Why Most Business Charts Try to Say Too Much
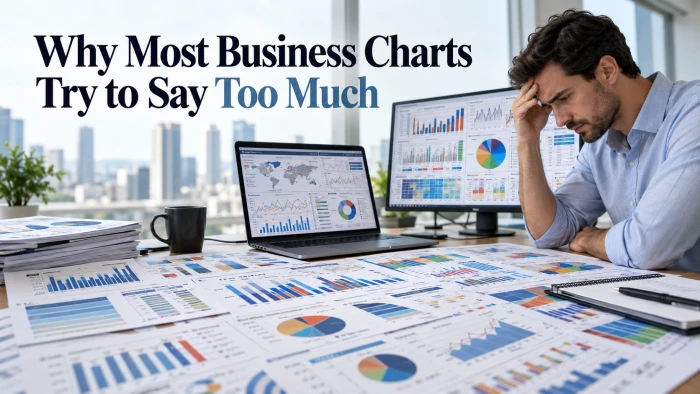
Here is an uncomfortable experiment. Pull up the last chart you presented. Hand it to someone who was not in the meeting...
Home / Blog
How to choose a chart, how to avoid misleading people with one, and what we are learning as we build ChartGPT.
Here is an uncomfortable experiment. Pull up the last chart you presented. Hand it to someone who was not in the meeting...
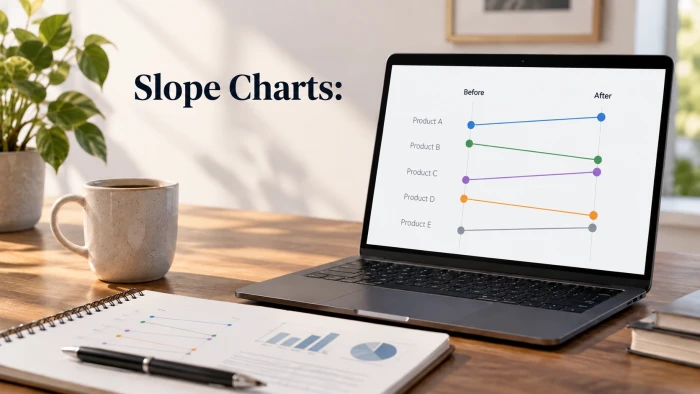
Your before and after data has a story. Your chart is hiding it.You ran the campaign. You changed the pricing. You launc...
Be honest. When was the last time your boss or client read your monthly social media report all the way to the end?If yo...
Your dashboard looks stunning. The colors are on brand, the charts are interactive, and leadership loves it. There is ju...
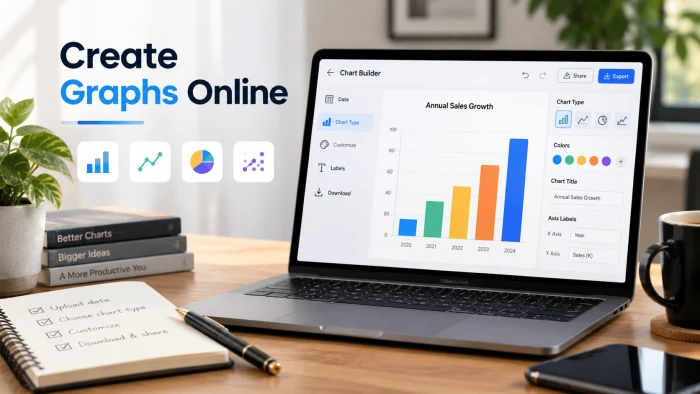
You can make a clean, presentation ready graph in your browser in under two minutes, with no Excel licence, no download,...
That is the uncomfortable truth behind most "misleading" charts. Nobody faked the data. Nobody changed a decimal. The ch...
A chart built for a report and a chart built for a room are two different objects. Confusing the two is one of the most...
Making a chart used to mean picking a chart type, fighting with axis settings and exporting three times before the label...
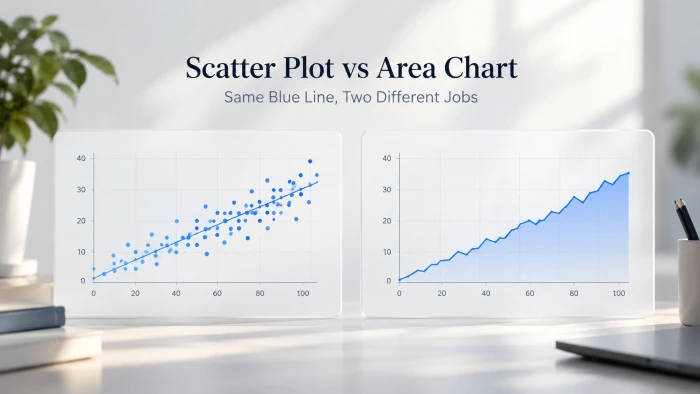
We pasted two small datasets into a scatter plot maker and an area chart maker, kept every default, and compared what ca...
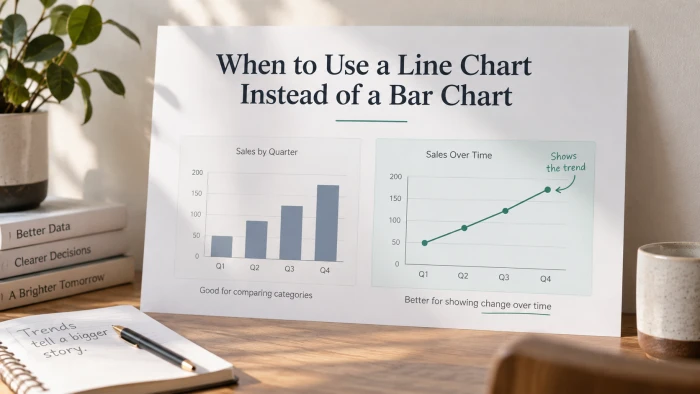
Most dashboards lean on the same two chart types. Picking the right one is the difference between a chart that shows num...
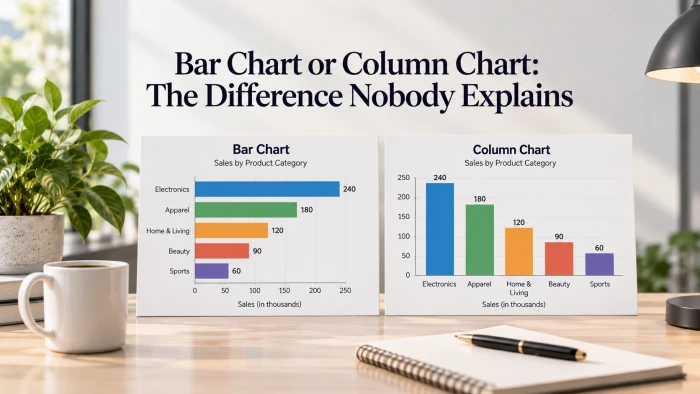
The short version. A column chart stands its bars up, growing vertically from a bottom axis. A bar chart lays them on th...
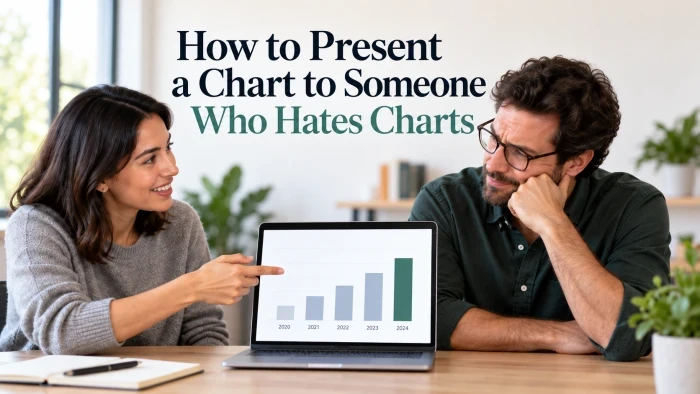
Some people go quiet the moment a graph appears. Here is how to land your point anyway, by treating the chart as backup...
Page 1 of 2 · 14 articles
Paste your numbers, describe what you want, and get a chart you can put straight into a deck. No account needed to try it.