That is the uncomfortable truth behind most "misleading" charts. Nobody faked the data. Nobody changed a decimal. The chart simply handed your brain a picture, and your brain did what it always does: it trusted the picture over the numbers.
We make up our minds about a chart at a glance. In that blink, the shape wins, the axis labels lose, and a perfectly honest graphic can plant a completely dishonest idea.
Take the 10 second test first
Look at the pie on the left. Without peeking at the bars, rank slices B, C and D from biggest to smallest.
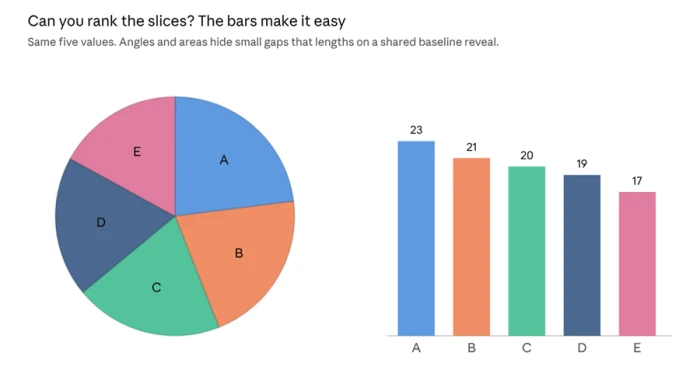
Hard, right? B, C and D look like triplets in the pie. On the bars, the ranking is instant: 21, 20, 19. Same data, same accuracy, completely different experience.
That gap between what a chart says and what it shows is where every trick below lives. Here are the seven most common ones, the science behind each, and how to catch them in seconds.
Trick #1: The Vanishing Zero
How a 13% rise was made to look like a 460% explosion.
Fox News once aired a bar chart about the top US income tax rate, which was set to rise from 35% to 39.6%. The numbers were right. But the y axis started at about 34%, so the second bar stood several times taller than the first.
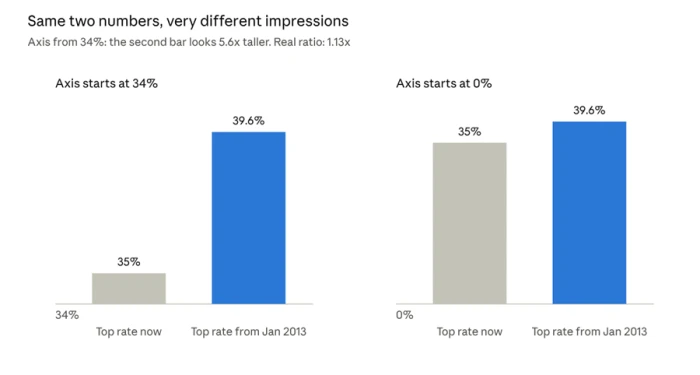
Bar charts encode value as length. Cut off the bottom of the axis and you cut off the honest comparison. Our eyes measure the bars, not the tick labels.
Here is the part that should worry you. In a 2020 study, researchers Michael Correll, Enrico Bertini and Steven Franconeri found that truncated axes made people rate differences as more severe in bar charts and line charts. The effect survived broken axis warning symbols. It even survived when people correctly wrote down the exact values. Knowing the numbers did not undo the picture.
But zero is not always holy. A chart of global temperature that starts at 0 degrees squashes real warming into a flat line, which misleads in the opposite direction. The honest test is simple: does the visual size of the change match how much the change matters?
Spot it in 3 seconds: read the lowest number on the y axis before you look at anything else.
Trick #2: The Two-Faced Axis
One chart, two rulers, and a story you can bend any way you like.
Dual axis charts put one series on a left scale and another on a right scale. Each scale can be stretched or squeezed freely, so the designer decides whether the lines cross, run side by side or race apart.
The UK Office for National Statistics demonstrated this by redrawing the same two data series with different axis settings. Every version was accurate. Every version told a different story.
Readers instinctively treat a crossing point as a moment of truth: "this is where A overtook B." On a dual axis chart, that crossing is often just where two arbitrary scales happen to meet.
Spot it in 3 seconds: two different y axes? Ignore where the lines meet and read each scale on its own.
Trick #3: The Shape Shifter
Why your brain is a ruler for lengths but a bad guesser for angles and areas.
Remember the 10 second test? There is a 40 year old reason you struggled.
In 1984, William Cleveland and Robert McGill of AT&T Bell Labs measured how accurately people read different visual encodings. Their ranking, from best to worst:
1. Position along a common scale (dot plots, aligned bars)
2. Position on separate but identical scales
3. Length
4. Angle and slope (pie slices)
5. Area (bubbles, treemaps)
6. Color shading
Jeffrey Heer and Michael Bostock reran the experiments online in 2010, and the ranking largely held.
Area is the sneakiest. Perception research shows we underestimate big areas, so a bubble with twice the area rarely looks twice as big. Tilt a pie into 3D and it gets worse: front slices swell and back slices shrink, purely from perspective.
Spot it in 3 seconds: comparing angles or bubbles? Hunt for printed values, or mentally line the items up as bars.
Trick #4: The Rainbow Mirage
The prettiest color scale is quietly drawing borders that do not exist.
Rainbow palettes are everywhere: weather maps, heat maps, scientific figures. The problem is brightness. Yellow is far lighter than the blues and reds beside it, so smooth data suddenly seems to have sharp edges and hot spots.
In a 2020 Nature Communications paper, Fabio Crameri, Grace Shephard and Philip Heron called rainbow and red green color maps "unscientific." They distort data and lock out the millions of people with color vision deficiency. Their fix: use palettes whose lightness rises evenly, so equal steps in data look like equal steps in color.
Spot it in 3 seconds: see a sharp band of yellow in otherwise smooth data? Check the legend before you believe the boundary.
Trick #5: The Log Scale Lullaby
The same outbreak can look like a rocket or a gentle ramp. It depends on one axis setting.
A logarithmic scale is not a trick on its own. It is often the right choice for anything that multiplies, like viruses, investments or populations. But a reader who misses the axis labels will read a straight line as steady, calm, linear growth.
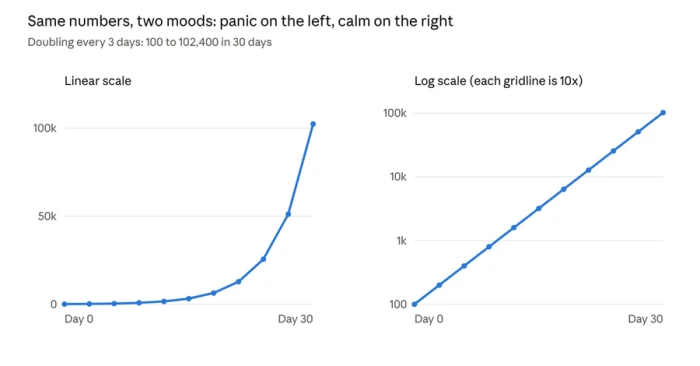
Both panels show exactly the same numbers. The left one screams. The right one shrugs. Neither is lying, yet a skimming reader would walk away with opposite feelings about the same crisis.
Spot it in 3 seconds: do the gridlines jump 10, 100, 1,000? You are looking at a log scale, and that straight line is exponential growth.
Trick #6: The Empty Land Map
Maps count acres. Your decisions should count people.
On a colored map, huge regions with few residents dominate the picture, while tiny, crowded cities nearly vanish. A state with a fraction of the population can look like it outweighs one with millions, just because it covers more ground.
The map is geographically perfect and still misleads about how many people a result affects. Raw counts make it worse, since big populations always produce big numbers. Rates per person tell you about risk; totals mostly tell you where people live.
Spot it in 3 seconds: ask how many people actually live inside the biggest colored shapes.
Trick #7: The Headline Hijack
The chart is honest. The words wrapped around it are doing the lying.
Your brain reads the title first, then looks for proof in the picture. That makes framing the most powerful trick of all, because it needs zero changes to the data.
• The loaded title. "Crime soars" above a small uptick tells you what to feel before you see anything. Studies of chart titles have found that slanted wording changes what readers remember from the very same graphic.
• The cherry picked window. Start a stock chart at a market low and any company looks like a genius. Move the start date a year and the hero becomes the villain.
• The stretched scatterplot. Back in 1982, Cleveland, Diaconis and McGill showed in Science that the same scatterplot looks more strongly correlated when the scales are widened and the dots squeezed together.
• The suggestive pair. Two lines rising together feel like cause and effect. Readers rarely ask what hidden third factor might be driving both.
Spot it in 3 seconds: cover the title with your thumb. Does the chart alone still say what the headline claims?
Plot twist: being smart will not save you
83.5% of people fell for it. Graph skills barely helped.
You might think these tricks only catch careless readers. The research says otherwise.
In a 2021 study, Brenda Yang and colleagues found that 83.5% of participants judged differences on truncated bar charts as bigger than the same differences on zero based charts. People's measured graph literacy did not predict who would be fooled. The bias is wired into how we see, not how much we know.
Researchers at Leiden University put it simply: because a graph hands you a picture at a glance, most people never stop to inspect it properly. And three mental shortcuts make it worse:
• Confirmation bias: we wave through charts that agree with us and nitpick the ones that do not.
• Anchoring: the first bar or point we notice becomes the yardstick for everything else.
• The authority glow: clean design and an official logo make a chart feel objective, which lowers our guard.
Want to feel this for yourself? The New York Times built an interactive called You Draw It that asks you to sketch a trend before revealing the real data. It is a humbling way to see how far your gut picture can sit from the real data.
The hopeful news: misreadings are fixable. The Leiden team found that clear corrections helped many readers update their view once the trick was pointed out.
The 30 second chart lie detector
Save this, and sharpen your eye further with Salesforce's free chart literacy module. Run any chart through it before you share, vote, invest or panic.
| Trick | The red flag | The 3 second check | If you make charts |
|---|---|---|---|
| 1. Vanishing Zero | Small change, giant bars | Read the bottom of the y axis | Start bars at zero |
| 2. Two-Faced Axis | Two y axes, dramatic crossing | Read each scale separately | Use side by side panels |
| 3. Shape Shifter | Pies, bubbles, 3D | Look for printed values | Use bars or dots on one scale |
| 4. Rainbow Mirage | Sharp yellow bands | Check the color legend | Use even lightness palettes |
| 5. Log Scale Lullaby | Calm straight line in a crisis | Do gridlines jump 10x? | Label log scales loudly |
| 6. Empty Land Map | Big colored regions | Ask how many people live there | Map rates, not totals |
| 7. Headline Hijack | Emotional title, short window | Cover the title, check the dates | Let the title state the finding fairly |
The bottom line
Accurate data is the floor, not the finish line. A great chart passes a second, harder test: does a busy person, glancing for a moment, walk away believing something true?
For chart makers, the rule is to make the visual size of every change match how much it really matters. For everyone else, the rule is even simpler. Slow down for three seconds. Read the axis. Check the scale. Ask what the chart is not showing you.
Your eyes will always grab the picture first. Now you know how to make your brain check their work.