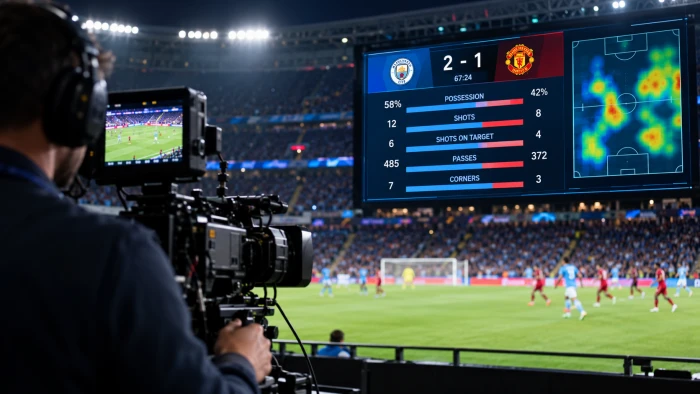
How Sports Broadcasts Make Stats Instantly Readable
You spend half a second looking at the screen. In that blink you somehow know the score, who has possession, the win pro...
You've seen the pattern. Someone spends three days building a dashboard with fourteen metrics, a dual axis, a colour gra...
Be honest. When was the last time your boss or client read your monthly social media report all the way to the end?If yo...
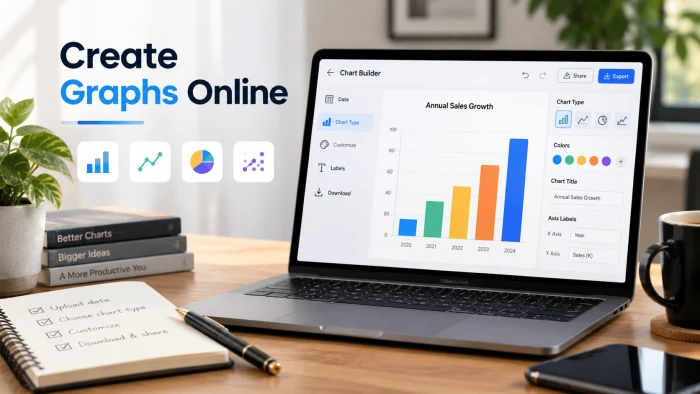
You can make a clean, presentation ready graph in your browser in under two minutes, with no Excel licence, no download,...
That is the uncomfortable truth behind most "misleading" charts. Nobody faked the data. Nobody changed a decimal. The ch...
Making a chart used to mean picking a chart type, fighting with axis settings and exporting three times before the label...
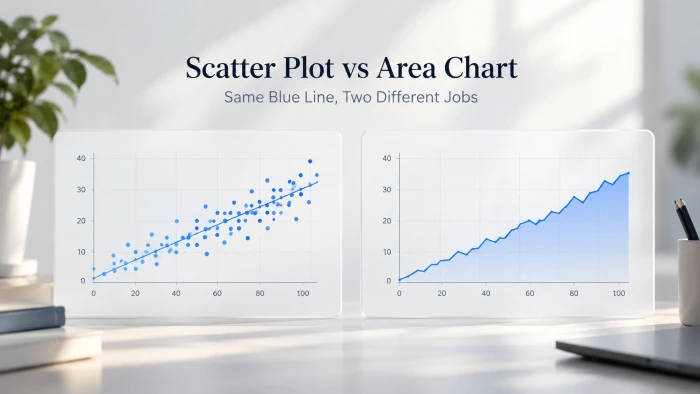
We pasted two small datasets into a scatter plot maker and an area chart maker, kept every default, and compared what ca...
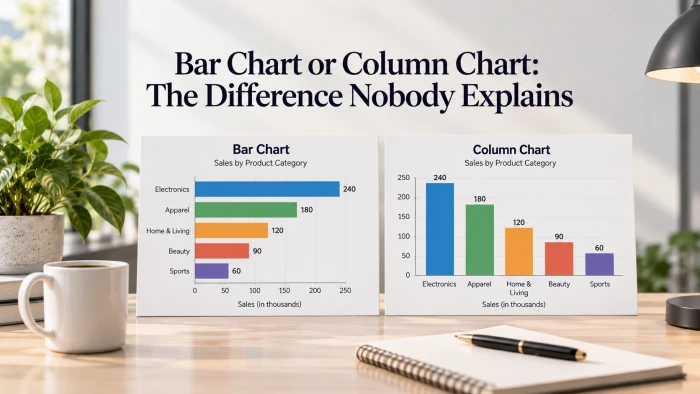
The short version. A column chart stands its bars up, growing vertically from a bottom axis. A bar chart lays them on th...
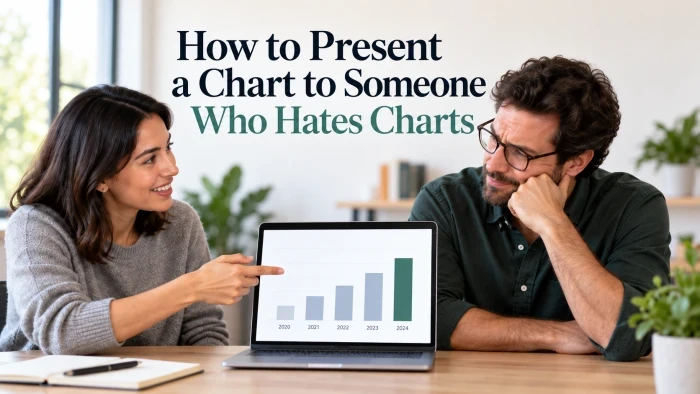
Some people go quiet the moment a graph appears. Here is how to land your point anyway, by treating the chart as backup...
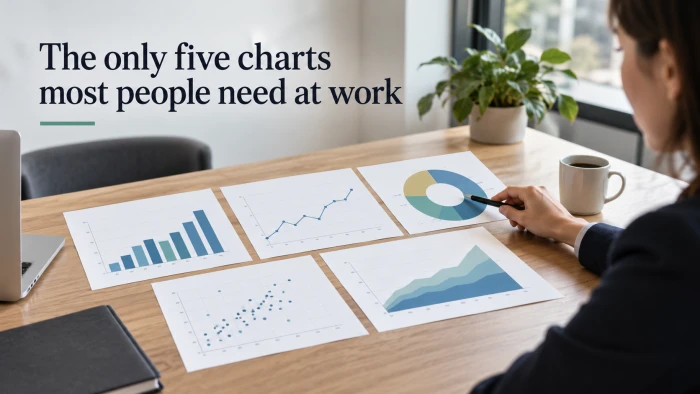
Nearly every question asked at work is one of five: which is bigger, how did it change, what is it made of, do these two...
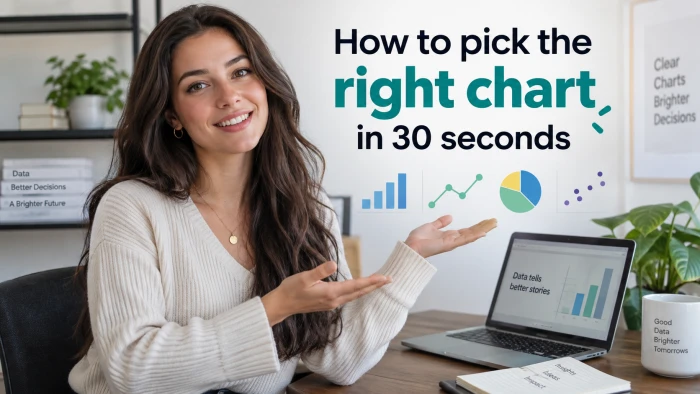
The one-sentence trickThe fastest way to pick a chart is to stop thinking about charts. Describe your data in one plain...
Paste your numbers, describe what you want, and get a chart you can put straight into a deck. No account needed to try it.