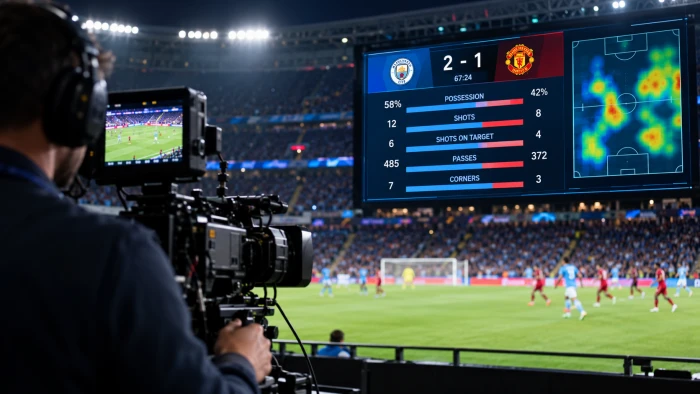
You spend half a second looking at the screen. In that blink you somehow know the score, who has possession, the win probability, and that a record just fell. You did not read anything. You just knew.
That is not luck. That is engineering. And once you see how it is done, you will never watch a game the same way again, because the exact same trick that makes a basketball graphic land in under a second can make your boss actually understand your report for once.
Here is the part nobody says out loud: the data is almost never the hard part. The framing is. Broadcast teams win or lose in the half-second your eye spends on the screen, and they have turned that half-second into a science. Let me pull back the curtain.
Why Raw Stats Die the Second They Hit the Screen
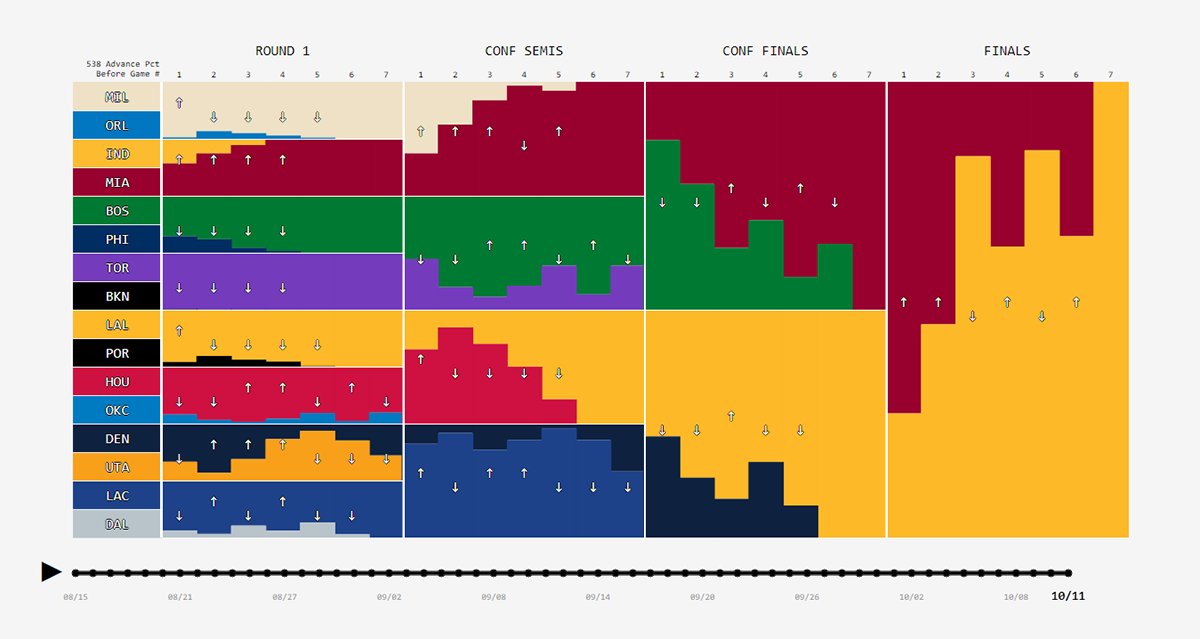
Picture a full stat sheet. Forty columns. Hundreds of numbers. Now imagine all of it dumped on your screen during a fast break. You would look away before your brain even started. Nobody has ever leaned in to read a spreadsheet during a touchdown.
The eye can only hold a few things at once, and during live action that budget shrinks to almost nothing. Decades of research from the Nielsen Norman Group on how people actually scan screens confirms the same thing broadcasters learned the hard way: viewers skim, they do not read, and clutter gets ignored. So broadcasters live by one ruthless rule: show the single number that matters this exact second, and bury everything else. Free throw? Shooting percentage. Fourth-quarter drive? Yards gained. The moment picks the stat. Everything that does not serve the moment is noise, and noise gets cut.
That one decision, what to leave out, is the whole game.
The Hidden Workflow Behind Every "Effortless" Graphic

What looks instant on screen is actually a tight, repeatable pipeline. Learn the sequence once and you will catch it running in every broadcast you watch for the rest of your life.
Step 1: Capture it live, fast, and dirty. Optical tracking cameras, sensors, and human stat operators push numbers into one central system in milliseconds. At this stage speed beats precision every time. A perfect number that arrives late is useless.
Step 2: Filter until one number survives. Producers kill everything except the single data point that tells the story of right now. A quarterback's completion percentage on a kickoff is meaningless, so it never appears. Ruthless subtraction is the job.
Step 3: Turn the number into a shape. This is where the real magic lives. A percentage becomes a bar. A trend becomes a line. A head-to-head becomes two colored blocks. Your brain reads shapes faster than it reads digits, so the digit almost always loses.
Step 4: Lock the visual language. Same font, same colors, same corner, every single time. That consistency is why your eye finds the score instantly without hunting. The moment the layout moves, the spell breaks.
Step 5: Time the reveal like a punchline. The graphic lands exactly when you are ready for it, usually in a pause, and vanishes before it turns into clutter. Timing is the difference between "clean" and "cluttered," and it is almost entirely invisible when done right.
Capture, filter, translate, standardize, time. That five-beat rhythm is the spine of every readable sports graphic ever made, and it works just as hard for a sales dashboard as it does for the Super Bowl.
The Design Tricks Doing the Heavy Lifting

With the workflow in place, designers reach for a handful of moves that make numbers feel obvious before you have consciously read them.
Color that means something instantly. Green is good, red is trouble, team colors are identity. You decode all three before your eyes even reach the label. Color is the fastest language on the screen.
Size as a pointing finger. The most important number is the biggest one, so your eye goes straight to it with zero effort. Hierarchy does the thinking for you.
Comparison over isolation. "68 percent" floating alone is abstract and forgettable. Drop "32 percent" next to it and the story tells itself. A number only becomes a story when it has something to beat.
Motion with a reason. A win-probability meter sliding in real time delivers an emotional gut-punch that a frozen number never could. Movement is reserved for moments that deserve a heartbeat. This whole discipline even has a name and a long history worth a detour: the field of data visualization has been refining these exact instincts for centuries.
If you want to feel this firsthand, try describing a comparison out loud, something like "show me these two teams side by side," and watch how naturally it becomes a visual in your head. A conversational tool like ChartGPT works on exactly that instinct, letting you ask for a chart in plain language instead of wrestling a spreadsheet for an hour, which is remarkably close to how a broadcast producer actually thinks.
How to Steal All of This for Your Own Work
You do not need a control room the size of a bus. Every principle above scales straight down to a quarterly report, a pitch deck, or a single social post.
Start the way they do: pick one hero stat per screen, the same way possession percentage owns the corner during a game. Then match the shape to the data. Trends over time want a line. Parts of a whole want a bar or a clean split. For static pieces like reports, a tool such as Datawrapper keeps those bars and lines sharp and legible without dragging you into hours of design fiddling, which is the entire point of this approach.
Want the animated, interactive feel of those sliding win-probability meters? Flourish handles motion and transitions so your numbers move with purpose and keep eyes locked instead of drifting. And when your data lives across a dozen sources and needs to breathe in one live view, Google Looker Studio stitches those feeds into a single clean output, the same way a broadcast truck fuses forty camera and sensor inputs into one calm picture on your screen.
The thread tying every one of these together is the pros' own production logic: capture, filter, translate, standardize, and time the reveal.
The Part Nobody Tells You
Here is the truth underneath all of it. Sports graphics feel effortless because every ounce of effort went into removing friction for you. The designers did the hard thinking so your brain would never have to. That is not decoration. That is respect for the viewer, engineered into every pixel.
So the next time a stat flashes up and you get it in a blink, remember there was an entire invisible workflow hiding inside that blink. The only difference between you and the people who built it is that now you know the steps.
Nothing is stopping you from making your own data just as instantly readable. Start with one number. Give it a shape. Put it in the same corner every time. The rest is just practice.