
A reader decides what your chart means in about two seconds. The words on the chart win that fight. The shiny bits lose it.
Open a deck, a dashboard, or a LinkedIn post and watch what your eyes actually do. They do not admire the drop shadow. They do not thank you for the gradient. They hunt for one thing: what is this telling me? If the chart answers in two seconds, it works. If it does not, no amount of polish rescues it.
That is the whole argument of this post. The title, the axis text, the units, the one number you want someone to remember: that is where meaning lives. Decoration mostly gets in the way. Below are two real cases that make it hard to argue with, plus a rule you can use on your very next chart.
The two-second test
Every chart gets read twice. The first read is a glance, and it is brutal. In that glance the reader is not comparing 4.81 to 4.82. They are asking what this is and why they should care. The second read, the careful one, only happens if the glance earns it.
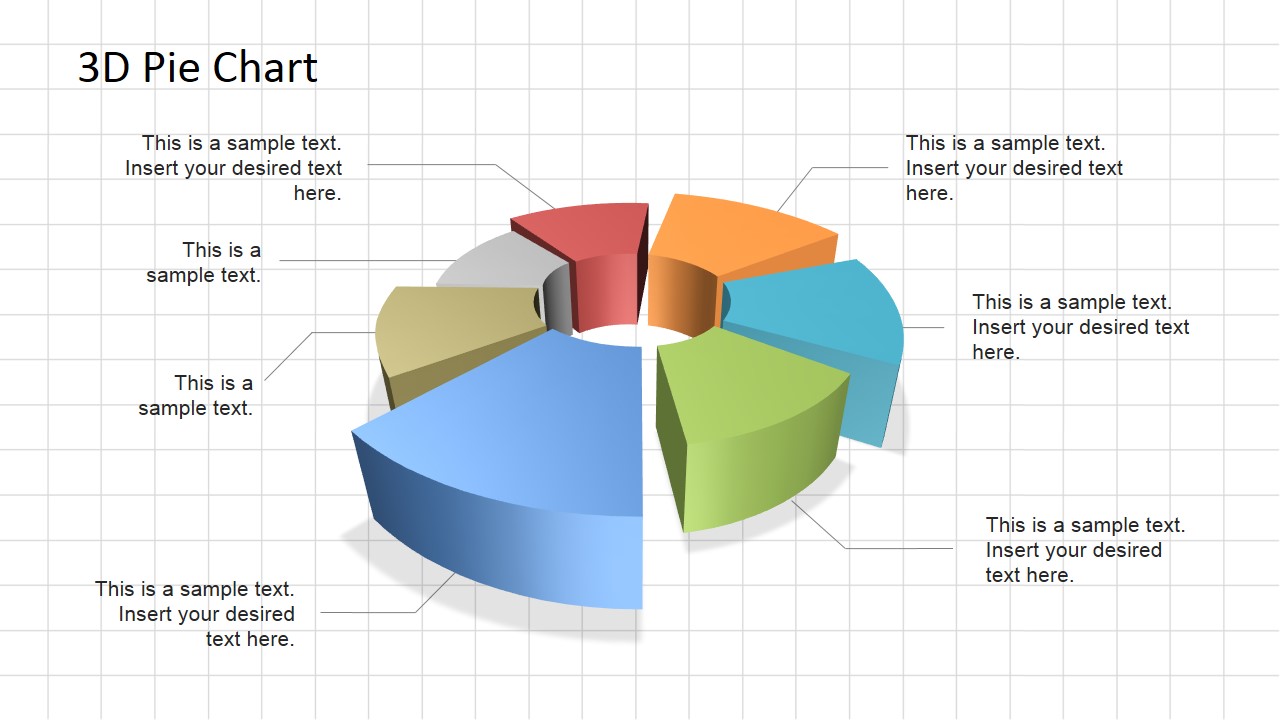
Labels are how you win the glance. A title that states the finding, a line labelled where it ends, a single highlighted bar: those land instantly. A legend you have to decode, four shades of blue you have to match up, a 3D angle you have to mentally un-tilt: those spend the reader's attention before they have understood anything. Decoration asks the reader to do work. Good labels do the work for them.
Case study 1: the pie chart that fooled a room full of fans
In 2008, Steve Jobs showed a pie chart of US smartphone market share. Apple's slice was labelled 19.5% and the "Other" slice was labelled 21.2%. The numbers were correct and clearly printed on the chart.
And yet the chart lied. It was drawn in pseudo-3D and tilted so Apple's slice sat at the front, which made the 19.5% section look bigger than the 21.2% section and led people to believe Apple had the second largest share when its slice was actually smaller. Ask anyone in that room which slice was bigger without reading the numbers, and they would have pointed at Apple's. It remains one of the most cited examples of a misleading graph in presentation history.
Here is the uncomfortable part. The label was right there, and it told the truth. The decoration told a different story, and the decoration won. That is the real danger of decorative design: it does not just distract from the label, it can quietly overrule it, because the eye trusts shape before it trusts text. If your decoration changes the answer a reader gives, it is not styling. It is misinformation with a nice finish.
Case study 2: how the Financial Times taught the world to read a chart
Now the opposite. In early 2020, FT data journalist John Burn-Murdoch published daily Covid-19 charts that millions of people relied on to understand the pandemic. They were not flashy. They won on labels.
Instead of a legend, he labelled each line directly at its end and colour-matched the text to the line, so you never glanced away to work out which country was which. One line was highlighted in a strong colour while the rest sat in grey, so the eye went straight to the point. A single red line in a sea of grey stands out instantly, but if every line is a different colour, nothing stands out at all. And the titles stated the finding rather than naming the variables.
The detail most people get wrong is that the answer is not to strip everything away. In testing, the most minimalist charts actually ranked lowest, because people want to be told what they are looking at rather than do all the work themselves. These charts worked because they added the right words, not because they removed everything. That labelling layer is where a chart earns trust, and where a grid of numbers becomes something a stranger reads in two seconds.
What a "label" actually means
When people hear "labels" they picture a cramped axis and move on, but it is bigger than that. A finding-first title does the heavy lifting, so "Churn doubled in March" beats "Churn by month". Axis text needs units, because a number with no unit is a riddle. The values that matter should be labelled directly on the chart rather than buried in a legend. Colour should point at one thing, because if everything is coloured, nothing is. And bars should start at zero, since a bar's length is the value.
The decoration that quietly hurts
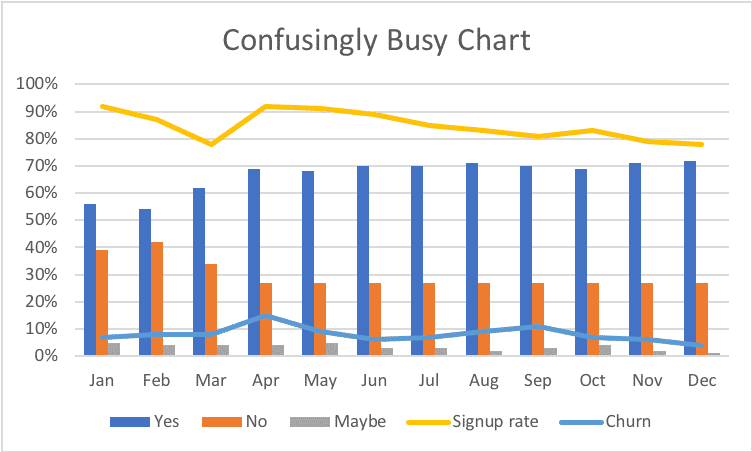
Good design helps, so this is not an argument for ugly charts. The problem is a specific set of flourishes that add nothing and cost clarity: 3D effects (the Apple problem, every time), gradients and heavy drop shadows that blur where a value starts and ends, rainbow palettes where colour carries no meaning, photos behind the plot, and a different colour for every single series. Edward Tufte named this decades ago: chartjunk. The test is simple. If an element does not help the reader understand faster, it is working against you, however good it looks on its own.
A thirty-second before and after
Picture a monthly churn chart. In the before, it is a 3D column chart with six colours, a legend off to the side, and the title "Churn by month". The reader has to match colours to months, un-tilt the columns in their head, and still does not know what they are meant to feel.
In the after, it is a single flat line with a zero baseline, every month in grey except March in red, a small "4.1%" label sitting right on the March point, and the title "Churn doubled in March after the price change". Same data. One of these gets a nod in a board meeting; the other gets a question about why the colours are so confusing. Nothing changed except the labelling and the restraint, and that is usually all it takes.
The rule that saves you every time
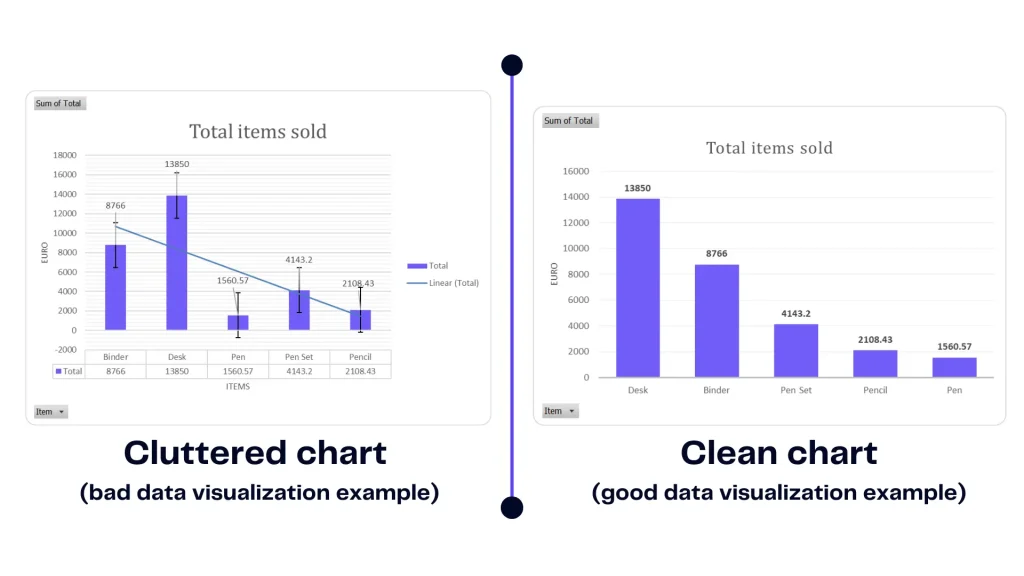
Here is a test you can run on any chart in five seconds: delete every colour, gradient and effect in your head, and keep only the words. If the chart still makes its point, your labels are doing their job and the design is just polish on top. If it does not, you have been leaning on decoration to carry meaning, and your reader will feel that strain even if they cannot name it. Pretty is a bonus. Readable is the product.
Where ChartGPT fits
Most people do not get labelling wrong because they are careless. They get it wrong at 11pm, under deadline, reaching for whatever the default tool hands them, and the default is often a legend and a rainbow.
That is the gap ChartGPT closes. Describe what the chart is for and it writes a title that states the finding rather than naming the variables. Bars start at zero. One series gets one colour, and when you want to point at a single bar, everything else goes grey. Axes come out labelled with units carried through. The labelling this whole post is about is the default, not a thing you have to remember.
Your chart does not need to be the prettiest thing in the deck. It needs to be read in two seconds. Get the labels right and it will be.