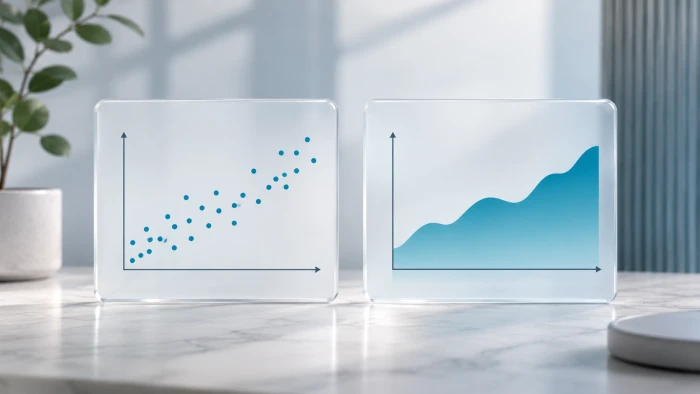
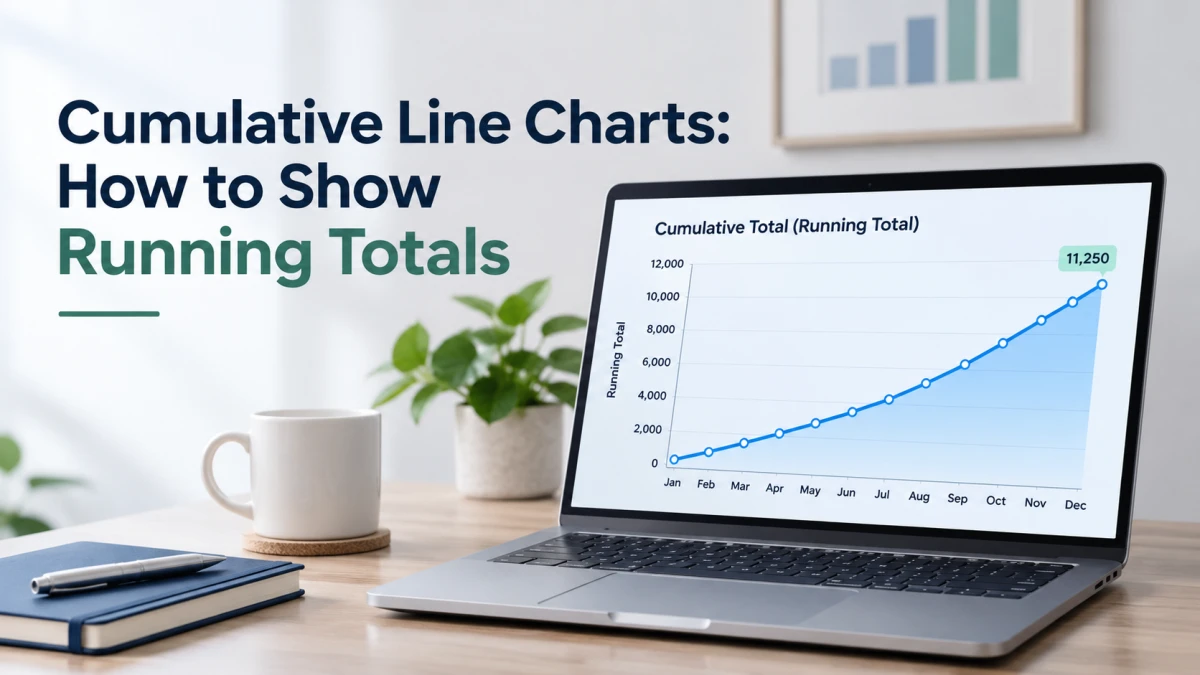
A regular line chart shows what happened in each period. A cumulative line chart shows how much has happened so far.
That makes it the right chart for questions like these. Are we on track to hit the target? Are we ahead of last year? How much have we sold in total?
Quick takeaways
- Each point is the current value plus everything before it.
- Height shows the total so far. Steepness shows how fast it is growing.
- It works best for goals, year to date comparisons and long term totals.
- The line never falls (unless values are negative), so it can hide a slowdown.
What is a cumulative line chart?
It is a line chart of a running total. Think of a jar of coins. A regular chart shows how many coins you added each day. A cumulative chart shows how full the jar is.
A steep line means a lot was added. A gentle line means a little. A flat line means nothing was added.
How to calculate a running total
Put your data in time order, then add each new value to the total before it.
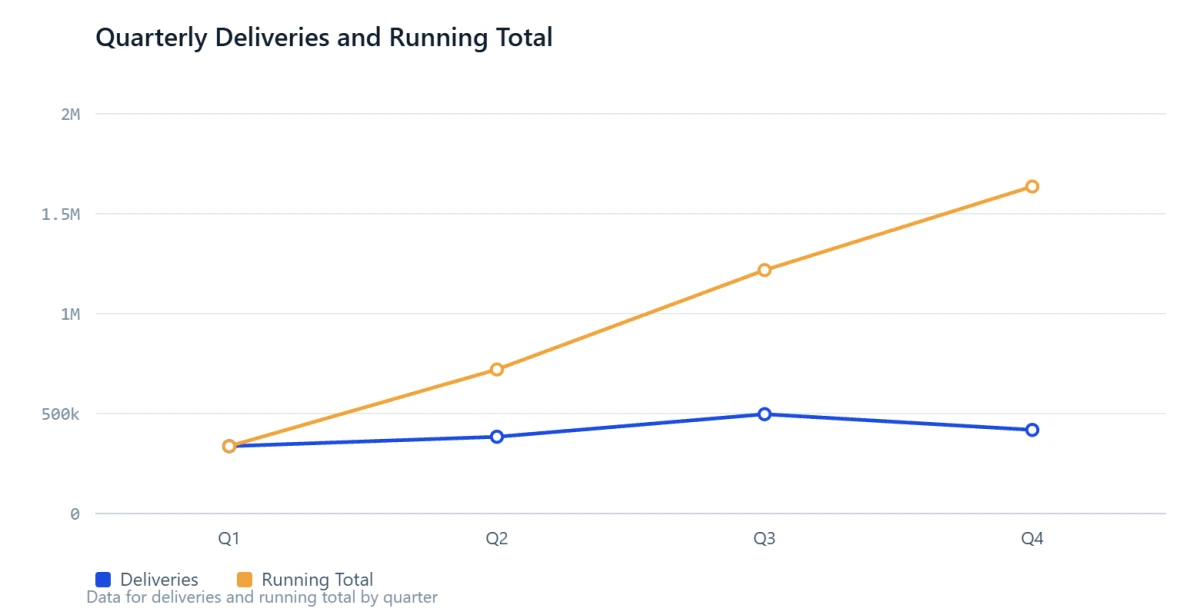
Here is a real example. Tesla delivered 336,681 vehicles in Q1 2025, 384,122 in Q2, 497,099 in Q3 and 418,227 in Q4.
Table 1: Tesla deliveries in 2025
| Quarter | Deliveries | Running total |
|---|---|---|
| Q1 | 336,681 | 336,681 |
| Q2 | 384,122 | 720,803 |
| Q3 | 497,099 | 1,217,902 |
| Q4 | 418,227 | 1,636,129 |
The last running total should equal the grand total, which here is Tesla's full year figure of 1,636,129. If it does not match, there is an error in the column.
Notice Q4. Quarterly deliveries dipped, but the running total kept climbing, only less steeply. That is the key difference between the two charts.
Example 1: Comparing years, year to date
Restart the running total each year and draw one line per year.
Tesla's 2024 quarterly deliveries were 386,810, then 443,956, then 462,890, then 495,570. In 2026 so far they are 358,023, then 480,126, then 486,532.
Table 2: Tesla running total by year (plot this)
| Through | 2024 | 2025 | 2026 |
|---|---|---|---|
| Q1 | 386,810 | 336,681 | 358,023 |
| Q2 | 830,766 | 720,803 | 838,149 |
| Q3 | 1,293,656 | 1,217,902 | 1,324,681 |
| Q4 | 1,789,226 | 1,636,129 | not yet reported |
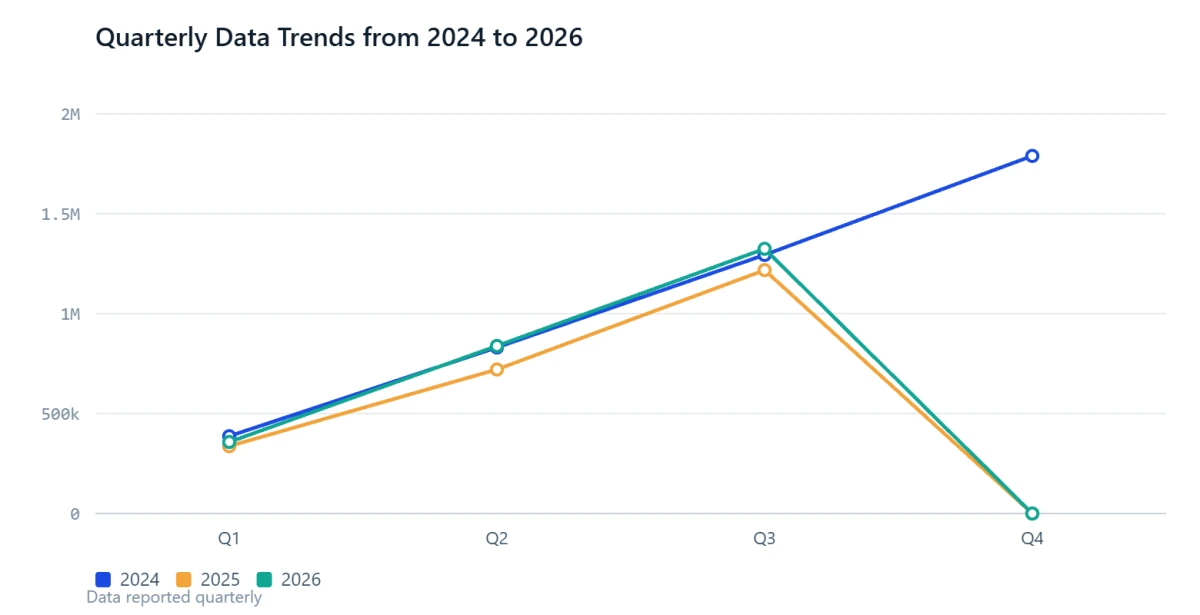
What the chart shows:
- 2025 trailed 2024 all year and finished 153,097 behind, about 8.6% lower.
- 2026 started behind 2024, then passed it. It trailed by 28,787 after Q1 and led by 7,383 after Q2. Where two lines cross, the lead changes.
- The gap to the target is easy to see. 2026 needs 464,545 deliveries in Q4 to match the 2024 total.
Example 2: Tracking progress toward a target
Add a horizontal target line and readers can see how far there is to go.
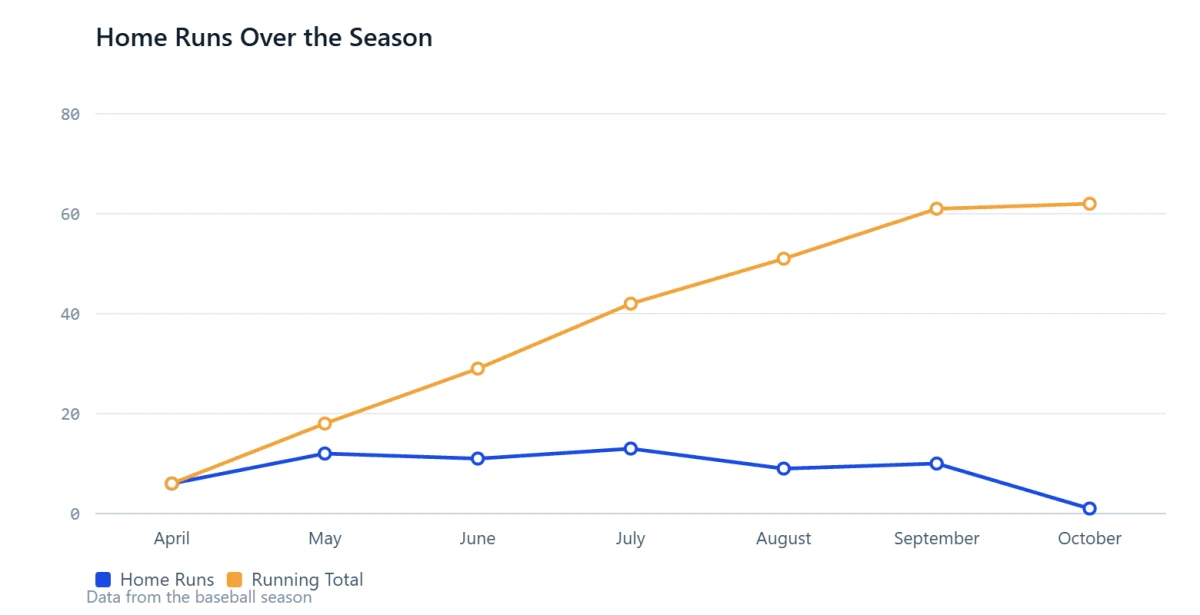
In 2022, Aaron Judge hit 62 home runs, passing the American League record of 61 set by Roger Maris in 1961. By month, he hit 6, 12, 11, 13, 9, 10 and 1.
Table 3: Aaron Judge home runs, 2022
| Month | Home runs | Running total |
|---|---|---|
| April | 6 | 6 |
| May | 12 | 18 |
| June | 11 | 29 |
| July | 13 | 42 |
| August | 9 | 51 |
| September | 10 | 61 |
| October | 1 | 62 |
Example 3: When the running total changes the story
In 2024, China emitted about 12.3 billion tonnes of CO2 and the United States about 4.9 billion. Added up since 1750, the United States has emitted about 435 billion tonnes and China about 285 billion.
Table 4: Annual vs cumulative CO2 emissions
| Country | Emitted in 2024 | Running total, 1750 to 2024 |
|---|---|---|
| United States | About 4.9 billion tonnes | About 435 billion tonnes |
| China | About 12.3 billion tonnes | About 285 billion tonnes |
China leads each year. The United States still leads the running total. Here the total is the number that matters, because most emitted CO2 stays in the atmosphere for centuries, so warming depends on the cumulative amount.
How to build one
Excel or Google Sheets: with values in column B, type =SUM($B$2:B2) in C2 and fill it down. Then insert a line chart from the period column and column C.
SQL:
SUM(deliveries) OVER (PARTITION BY year ORDER BY quarter) AS running_total
Python (pandas):
df["running_total"] = df.groupby("year")["deliveries"].cumsum()
BI tools: Tableau has a Running Total quick table calculation, Power BI has a Running total quick measure, and Looker Studio has a Running sum option.
ChatGPT (no formulas needed):
- Put the quarterly figures from Example 1 in a file with three columns: year, quarter, deliveries. ChatGPT accepts .xls, .xlsx and .csv files, and works best with clear column names and one record per row.
- Upload it with a prompt like this:
Add a running_total column that is the cumulative sum of deliveries, restarting each year. Show me the table, then draw a line chart of running_total by quarter with one line per year. Start the y axis at zero, label the last point of each line, and stop 2026 at Q3.
- Check the result. The lines should end at 1,789,226 for 2024, 1,636,129 for 2025 and 1,324,681 for 2026.
Two tips: say "cumulative" or "running total" clearly, because ChatGPT may pick a different method or chart type on the first try. Upload a file, not a screenshot, because it may not read exact values reliably from images.
Design tips
- Say "cumulative" in the title or axis label.
- Start the y axis at zero.
- Label the last point of each line with its value.
- Add a target line when there is a goal.
- Keep to about two to five lines, with one highlighted.
- Stop the line at the last real data point. A flat line reads as "nothing happened".
The most common mistake: hiding a slowdown
Because the line cannot go down, every cumulative chart looks like growth.
At a 2013 iPhone presentation, Tim Cook showed a cumulative sales chart. Quartz pointed out that it had no scale, and that while the all time total had passed 400 million, quarterly sales had fallen over the previous three quarters.
Apple sold 47.8 million iPhones in the last three months of 2012, up from 26.9 million the quarter before. The next two quarters came in at 37.4 million and 31.2 million.
Table 5: iPhone unit sales before the 2013 event
| Quarter | Units sold (millions) | Running total (millions) |
|---|---|---|
| Jul to Sep 2012 | 26.9 | 26.9 |
| Oct to Dec 2012 | 47.8 | 74.7 |
| Jan to Mar 2013 | 37.4 | 112.1 |
| Apr to Jun 2013 | 31.2 | 143.3 |
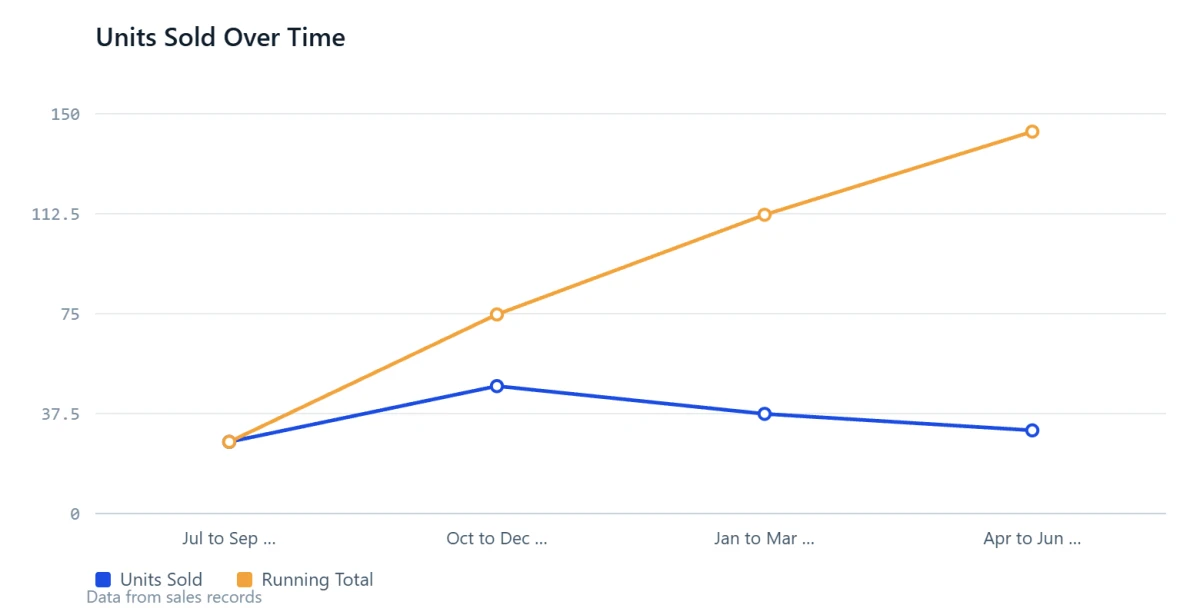
To be fair, iPhone sales are seasonal, and the 31.2 million was up from 26 million a year earlier. A running total alone cannot show whether sales per period are rising or falling, so show both views when that matters.
Three more mistakes to avoid:
- No axis values. Without a scale, a running total is only a shape.
- Different start dates. Align products by time since launch before comparing them.
- Double counting. If your data is already year to date, do not sum it again.
When to use it
| Use a cumulative line chart when | Use something else when |
|---|---|
| You track progress toward a goal | You care about period to period change |
| You compare this year with last year, to date | You want to show seasonality |
| The total is what matters | The value is a level, such as temperature or stock price |
A quick test: if adding the values together makes sense, a running total makes sense. Adding daily sales works. Adding daily temperatures does not.
Final thoughts
A cumulative line chart turns “how much per period” into “how much so far”. That one change makes it the best chart for three jobs: tracking progress toward a goal, comparing this year with last year, and showing totals that build over a long time.
Each example in this guide showed one of those jobs. Tesla’s deliveries showed which year was ahead at any point. Aaron Judge’s season showed the distance left to a target. The CO2 data showed how a running total can tell a different story from the yearly numbers.
The Apple example showed the limit. A running total always looks like growth, so it cannot tell you whether the latest period was strong or weak.
Keep three habits and your chart will stay clear and fair:
- Label the chart as cumulative and start the y axis at zero.
- Check that the last point matches your known total.
- Keep a per period chart close by when the recent trend matters.
The easiest way to learn is to try it. Take one metric you already report each month, add a running total column, and plot it next to your target. You will see within minutes whether you are on pace.