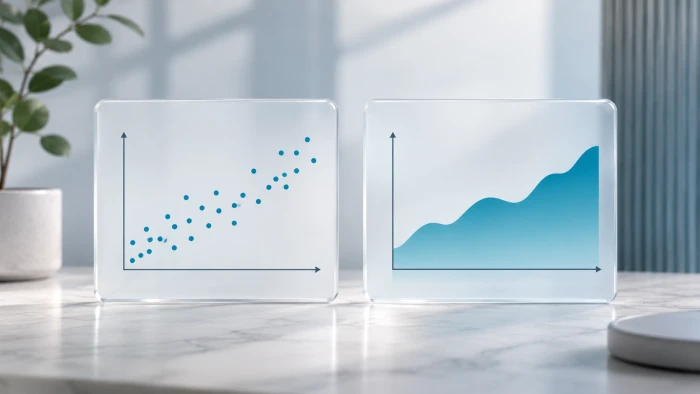
Good data can still tell a confusing story if it sits in the wrong chart. Scatter plots and area charts are both popular and both useful, but they answer very different questions.
This guide explains each chart in plain language, walks through real datasets, and ends with a quick checklist for your next report.
The short answer
- A scatter plot tells a relationship story. It shows how two measures are connected.
- An area chart tells a change story. It shows how something grows, shrinks, or shifts over time.
Neither is better in general. The better chart is the one that matches your question.
What Is a Scatter Plot?
A scatter plot places dots on a grid. Each dot is one item, such as a country, a customer, or a product. The dot's left-to-right position shows one number, and its bottom-to-top position shows another.
Reach for a scatter plot when you want to see:
- Correlation: do two measures rise and fall together?
- Clusters: do items fall into natural groups?
- Outliers: which items break the pattern?
Scatter plots are also easy to read accurately. A well-known 1984 study by Cleveland and McGill ranked position along a common scale as the visual task people judge most accurately, ahead of length, angle, and area. A scatter plot relies entirely on position.
Scatter Plot in Action: Does More Health Spending Mean Longer Lives?
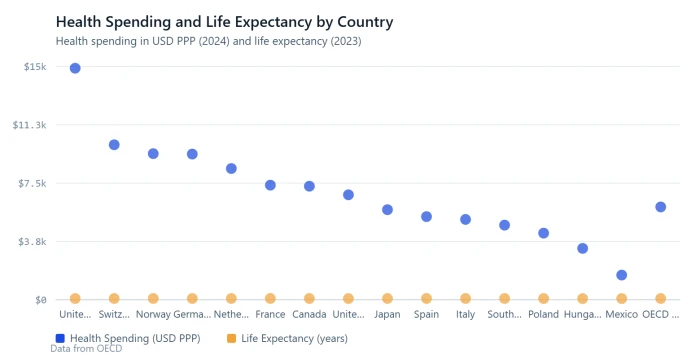
The OECD compares health systems across its 38 member countries. The table below pairs two numbers for 15 of them: how much each country spends on health per person, and how long its people live on average.
| Country | Health spending per person (USD PPP, 2024) | Life expectancy (years, 2023) |
|---|---|---|
| United States | 14,885 | 78.4 |
| Switzerland | 9,963 | 84.3 |
| Norway | 9,393 | 83.1 |
| Germany | 9,365 | 81.1 |
| Netherlands | 8,436 | 81.9 |
| France | 7,367 | 83.0 |
| Canada | 7,301 | 81.7 |
| United Kingdom | 6,747 | 81.0 |
| Japan | 5,790 | 84.1 |
| Spain | 5,346 | 84.0 |
| Italy | 5,164 | 83.5 |
| South Korea | 4,797 | 83.5 |
| Poland | 4,284 | 78.4 |
| Hungary | 3,303 | 76.7 |
| Mexico | 1,588 | 75.5 |
| OECD average | 5,967 | 81.1 |
Source: OECD, Health at a Glance 2025. Spending is for 2024 and life expectancy for 2023, or the nearest year (Mexico's life expectancy is 2024). PPP means purchasing power parity, which adjusts for price differences between countries.
What the chart reveals
- A clear upward pattern. Countries that spend more tend to live longer. Mexico sits at the bottom left (USD 1,588 and 75.5 years) and Switzerland at the top right (USD 9,963 and 84.3 years). The OECD describes this as a clear positive association.
- A high-value cluster. Spain, Italy, South Korea, and Japan all spend less than the OECD average, yet their people live 83.5 years or longer. The OECD counts nine countries that spend less than average and still live longer than average.
- One dramatic outlier. The United States spends USD 14,885 per person, more than any other country, yet its life expectancy is 78.4 years, below the OECD average of 81.1. That is about 2.5 times the average spending for 2.7 fewer years of life. Poland reaches the same 78.4 years on less than a third of the money.
A table can hold all of these numbers, but a scatter plot shows the pattern and the exception at the same time. The dot sitting far to the right and well below the trend is the story.
One caution: a pattern in a scatter plot is not proof of cause. The OECD itself notes that these are simple associations, and that risk factors such as smoking, alcohol, and obesity, along with income and education, also shape health outcomes.
What Is an Area Chart?
An area chart is a line chart with the space below the line filled in. The horizontal axis is almost always time. The fill adds visual weight, so readers sense the size of something as well as its direction.
There are three common versions:
- Simple area chart: one series. Good for showing how big something has become.
- Stacked area chart: several series stacked on top of each other. Shows the total and what each part adds to it.
- 100% stacked area chart: every point in time adds up to 100%. Shows how the mix changes.
Area Chart in Action: How the World's Electricity Mix Changed
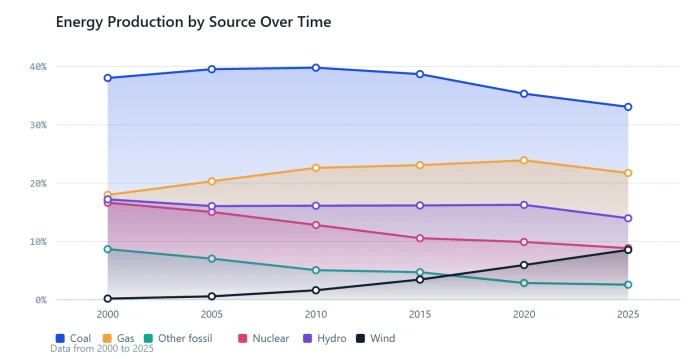
Where does the world's electricity come from? The table shows the share from each source at five-year intervals.
| Year | Coal | Gas | Other fossil | Nuclear | Hydro | Wind | Solar | Bioenergy |
|---|---|---|---|---|---|---|---|---|
| 2000 | 38.02 | 17.97 | 8.67 | 16.63 | 17.21 | 0.20 | 0.01 | 1.01 |
| 2005 | 39.52 | 20.30 | 7.05 | 15.04 | 16.06 | 0.58 | 0.02 | 1.17 |
| 2010 | 39.78 | 22.61 | 5.07 | 12.82 | 16.12 | 1.63 | 0.15 | 1.54 |
| 2015 | 38.68 | 23.08 | 4.72 | 10.55 | 16.17 | 3.46 | 1.07 | 1.97 |
| 2020 | 35.32 | 23.89 | 2.88 | 9.91 | 16.27 | 5.96 | 3.19 | 2.25 |
| 2025 | 33.06 | 21.73 | 2.58 | 8.85 | 13.97 | 8.55 | 8.76 | 2.22 |
Source: Ember, Yearly Electricity Data, as published by Pew Research Center (July 2026). Figures are % of global electricity generation. "Other fossil" covers oil and petroleum products, manufactured gases, and waste. Other renewables such as geothermal and tidal (about 0.3% each year) are left out, so rows total slightly under 100.
What the chart reveals
- Fossil fuels are slowly losing ground. Coal, gas, and other fossil fuels produced 57% of the world's electricity in 2025, down from 65% in 2000.
- A new wedge appears. Wind and solar together made up 0.2% of the mix in 2000, 4.5% in 2015, and 17.3% in 2025. On the chart they start as a thin sliver and then fan out.
- Nuclear's band gets thinner. Its share fell from 17% in 2000 to 9% in 2025.
- A crossover moment. In 2025, renewables as a group (about 34%) passed coal (about 33%) for the first time.
One thing to watch: share is not the same as amount. Hydro's share slipped from 17.2% to 14.0%. Yet hydropower produces far more electricity today than in 2000, because total generation more than doubled, from 15,279 TWh to 31,734 TWh. A 100% stacked chart shows the mix. To show amounts, stack the actual TWh values instead.
Same Topic, Two Charts: The Rise of Solar
One topic can call for both charts. It depends on the question you ask.
| Year | Solar panel price (USD per watt) | Global solar generation (TWh) |
|---|---|---|
| 2010 | 2.44 | 32 |
| 2012 | 1.08 | 97 |
| 2014 | 0.77 | 198 |
| 2016 | 0.66 | 327 |
| 2018 | 0.50 | 575 |
| 2020 | 0.36 | 853 |
| 2022 | 0.36 | 1,333 |
| 2024 | 0.26 | 2,143 |
Source: Pew Research Center (July 2026), using Ember for generation and Our World in Data for panel prices. Prices are in constant 2024 US dollars per watt. Generation is rounded to the nearest TWh.
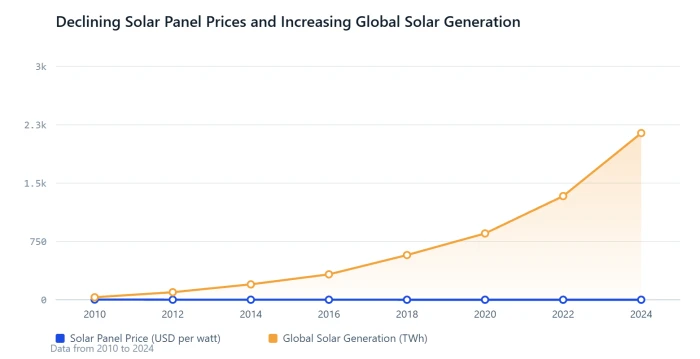
Question 1: How fast did solar grow? That is a change story, so use an area chart. Generation went from 32 TWh in 2010 to 2,143 TWh in 2024, roughly 66 times higher. In 2025 it reached 2,778 TWh and passed wind for the first time. The filled shape makes that surge feel as big as it is.
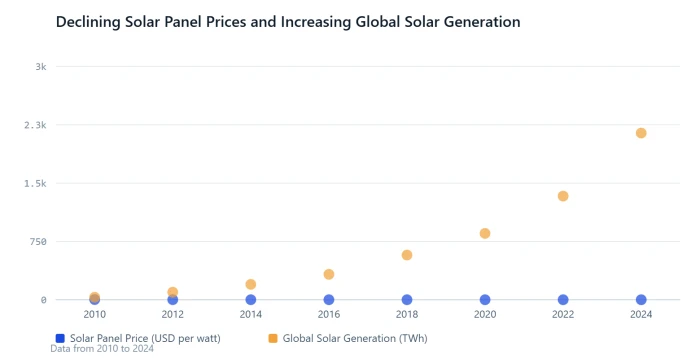
Question 2: Did cheaper panels go hand in hand with more solar power? That is a relationship story, so use a scatter plot. Panel prices fell from USD 2.44 to USD 0.26 per watt, a drop of about 89%, while generation soared. The dots run from the lower right (expensive panels, little solar) to the upper left (cheap panels, lots of solar).
The scatter plot also shows a detail the area chart hides. Between 2020 and 2022 the price stayed at USD 0.36, yet generation still rose by more than half. Price matters, but it is not the only driver.
Head to Head
| Scatter plot | Area chart | |
|---|---|---|
| Main question | How are two things related? | How did something change over time? |
| Each mark is | One dot per item | One filled band per series |
| X axis | Any numeric measure | Time, almost always |
| Shows best | Correlation, clusters, outliers | Trends, totals, parts of a whole |
| Data you need | Two numbers for every item | One number per time period, per series |
| Works well with | Dozens to thousands of points | One to about six series |
| Y axis from zero? | Not required | Yes |
| Biggest risk | Mistaking correlation for cause | Middle layers are hard to read |
| Example in this post | Health spending vs life expectancy | Electricity mix, 2000 to 2025 |
Common Mistakes (and Easy Fixes)
Scatter plot mistakes
- Treating correlation as cause. Say "is linked to" unless you have other evidence.
- Too many overlapping dots. Make the dots smaller or partly transparent.
- Unlabeled outliers. Label the few dots that carry the story. In the health example, that means the United States.
- Using it for a simple trend. One measure over time belongs in a line or area chart.
Area chart mistakes
- Too many layers. More than five or six bands becomes a striped blur. Group small categories into "Other".
- Expecting exact readings from middle layers. Only the bottom band sits on a flat baseline. The rest float on whatever lies beneath them. Put the key series at the bottom or add labels.
- Cutting off the y axis. The filled area stands for quantity, so the axis should start at zero.
- Overlapping see-through areas. Layers hide one another. Stack them or switch to lines.
Swapping the two
- The health data as an area chart would draw a filled shape running from Mexico to Hungary to Poland. That suggests a flow between countries that does not exist.
- The electricity data as a scatter plot would give you 208 separate dots (26 years times 8 sources), with no sense that they add up to a whole.
How to Choose in 30 Seconds
- Is time on your x axis? If yes, lean toward an area chart. If no, lean toward a scatter plot.
- What should the reader notice? A link, a cluster, or an outlier points to a scatter plot. Growth, decline, or a changing mix points to an area chart.
- What does one data point represent? A thing (country, customer, product) suits a scatter plot. A moment in time suits an area chart.
- Do your parts add up to a meaningful total? If yes, use a stacked area chart.
A quick headline test also works. If your headline contains "vs" or "linked to", you likely need a scatter plot. If it contains "over time", "growth of", or "share of", you likely need an area chart.
The Verdict
So which one tells a better story? It depends on the story.
- Use a scatter plot when the story is about a relationship: who follows the pattern and who breaks it.
- Use an area chart when the story is about change: how much, how fast, and what the total is made of.
The solar example shows it best. Same topic, same years, two different questions, two different charts. Start with the question, and the chart choice follows.