
74% sounds fine, until you see the line
In October 2026, 74.0% of the roughly 2.5 million A&E attendances in England were dealt with within four hours.
Is that good? You can't tell, and neither can your reader. Now add one line: the NHS Constitution standard is 95%. The same number now means a 21-point shortfall.
Most charts fail in this way. The data is accurate, the colours are tidy, and the reader still has to ask "compared to what?" This guide shows seven ways to answer that question on the chart itself, then tests them on three real datasets.
Target vs benchmark: they are not the same thing
A target is a number someone chose. It has an owner and usually a deadline, such as a sales quota or the Federal Reserve's 2% inflation goal.
A benchmark is a number the outside world produced. Nobody set it; it is simply what peers, the market or last year achieved, such as an industry average.
The difference affects design. A target is a commitment, so the chart should show hit or miss. A benchmark is context, so the chart should show position and distance. Mixing the two on one unlabelled line is the fastest way to confuse a reader.
Seven ways to show a target or benchmark
1. Reference line. A single horizontal line across a time series. Use it when the target is one fixed number. Label the line directly, not in a legend.
2. Target band. A shaded range instead of a line. Use it when the goal is a range (an acceptable 1–3%) or when the benchmark is an estimate with a margin of error.
3. Target marker per period. A small tick above each bar or point. Use it when the target changes over time, because one flat line would misrepresent it.
4. Bullet graph. A bar for the actual value with a marker for the comparison. Stephen Few designed it to replace dashboard meters and gauges, combining a featured measure with one or two comparative measures and optional qualitative ranges. Use it for many KPIs in a small space.
5. Gap chart. Plot the difference from the benchmark instead of the raw value, so the zero line becomes the benchmark. Use it when the gap is the story.
6. Trajectory line. Draw the planned path beside the actual path. Use it for cumulative goals, such as year-to-date revenue against plan.
7. Grey peer series. Show competitors or the average in grey and your own series in one accent colour. Use it when the benchmark is a group, not a number.
Which one should you pick?
| Your situation | Best method |
|---|---|
| One fixed target, data over time | Reference line |
| Target is a range, or benchmark is uncertain | Target band |
| Target changes each period | Marker per period |
| Many KPIs on one dashboard | Bullet graph |
| Small gaps on a large scale | Gap chart |
| Cumulative goal with a deadline | Trajectory line |
| Comparing yourself with peers | Grey peer series |
Case study 1: the Fed's 2% line
The setup. The Federal Reserve's official 2% target is defined on the PCE price index, not CPI. One fixed number makes this the textbook case for a reference line.
The data. PCE inflation was 2.8% in January 2026, reached 3.5% in March and 3.8% in April. By September it stood at 3.6%, after 3.4% in July and August. The index has stayed above the Fed's target since 2021.
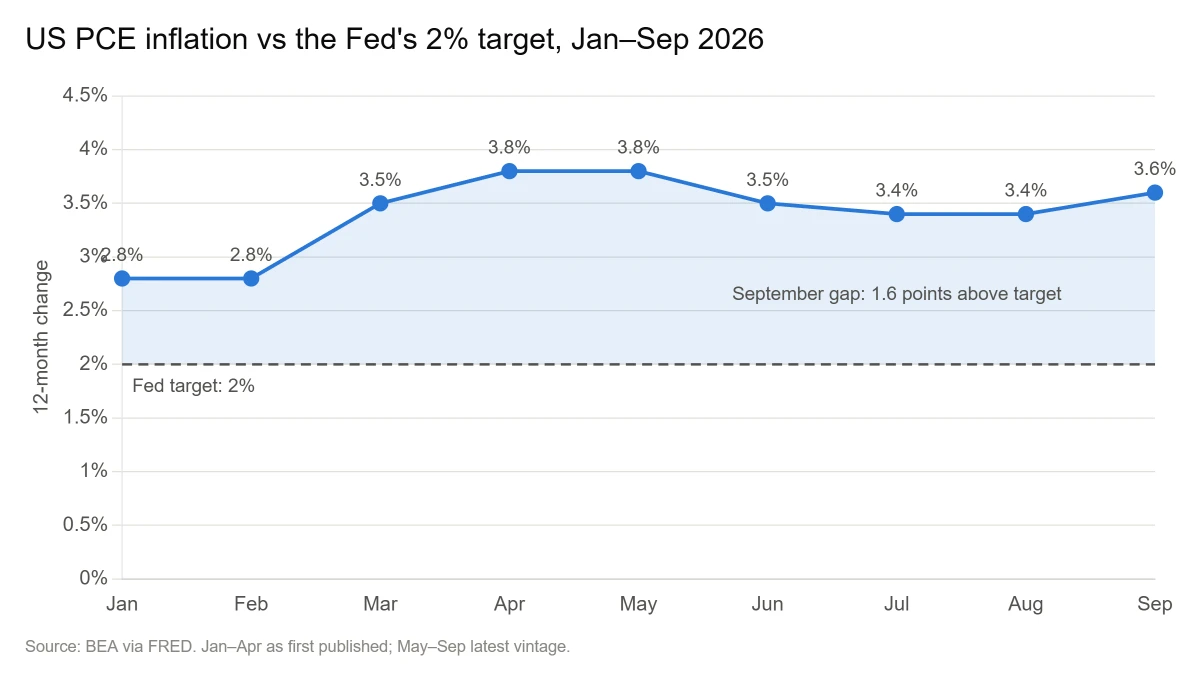
What the chart does. The dashed line at 2% and the shaded area above it turn nine data points into one message: inflation is 1.6 points over target, which is 80% above the goal. The axis starts at zero, so the size of that gap is shown in true proportion.
The lesson. For a fixed target, one labelled line is enough. Add the gap as a number in the title or tooltip so the reader does not have to subtract.
Case study 2: the NHS target that keeps moving
The setup. The 95% four-hour standard has been in the NHS Constitution since 2010-11, and the last year it was met nationally was 2013-14, at 95.7%. The last single month it was met was July 2015. Since 2023, NHS England has set lower interim targets several times.
The data.
| Checkpoint | Interim target | Actual |
|---|---|---|
| March 2024 | 76% | 74.2% |
| March 2025 | 78% | 75.0% |
| March 2026 | 78% | 77.1% |
| October 2026 | 82% by March 2027 | 74.0% |
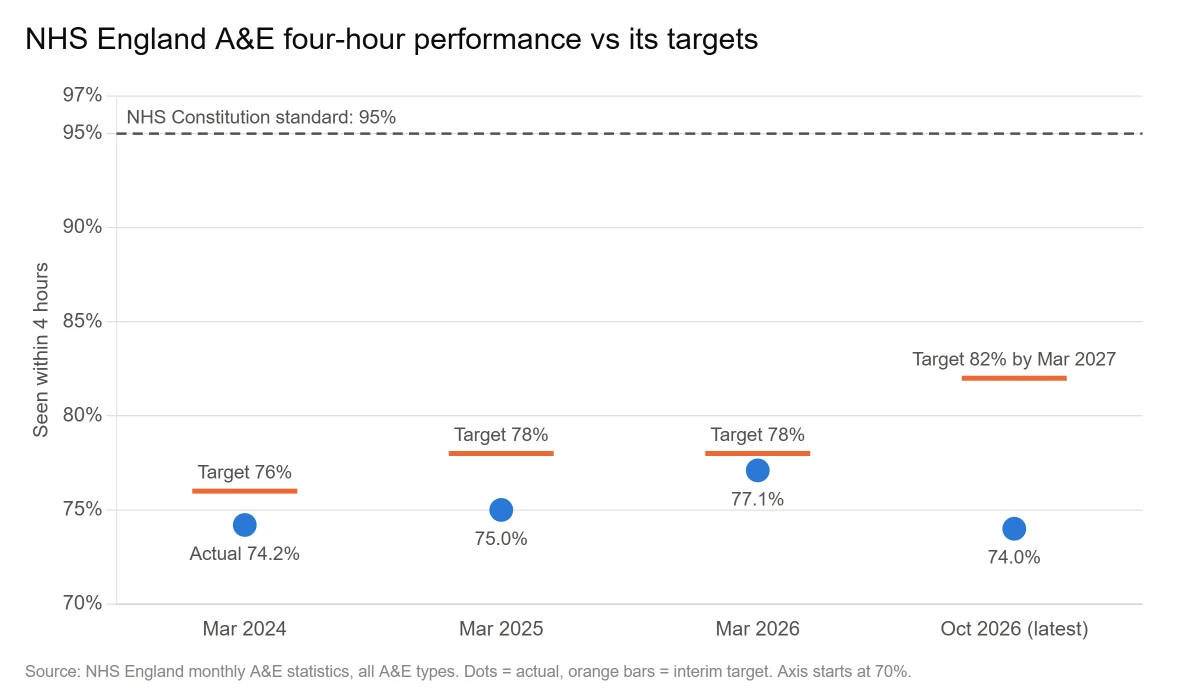
What the chart does. Each dot gets its own target tick, so the reader sees every miss at its true size. The 95% line stays in view above everything. Without it, March 2026 looks like a near win at 0.9 points short. With it, the same result is 17.9 points under the original standard.
The spread behind the average. Among major A&E trusts in October 2026, Northumbria Healthcare reached 89.6% while East Cheshire managed 47.9%. Of 115 trusts, six reached 82% and none reached 95%.
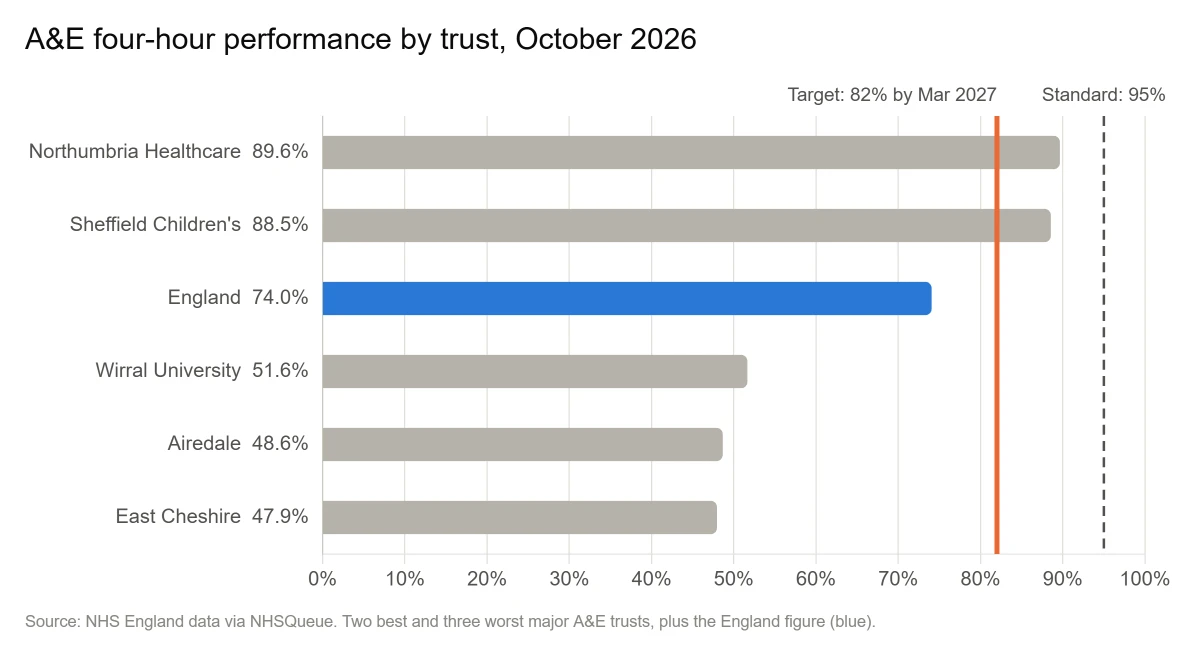
The lesson. When targets move, mark each period with its own target and keep the long-term standard visible. When an average hides a 42-point spread, use bullet-style bars so every unit is measured against the same markers.
Case study 3: PISA and the benchmark nobody set
The setup. The mean maths score across OECD countries in PISA 2022 was 472 points. No one chose that number, which makes it a benchmark and not a target.
The data. Singapore scored 575, 103 points above the average. Japan scored 536, Korea 527, Canada 497 and the United Kingdom 489. Germany scored 475 and France 474, while the United States scored 465. Greece scored 430 and Mexico 395.
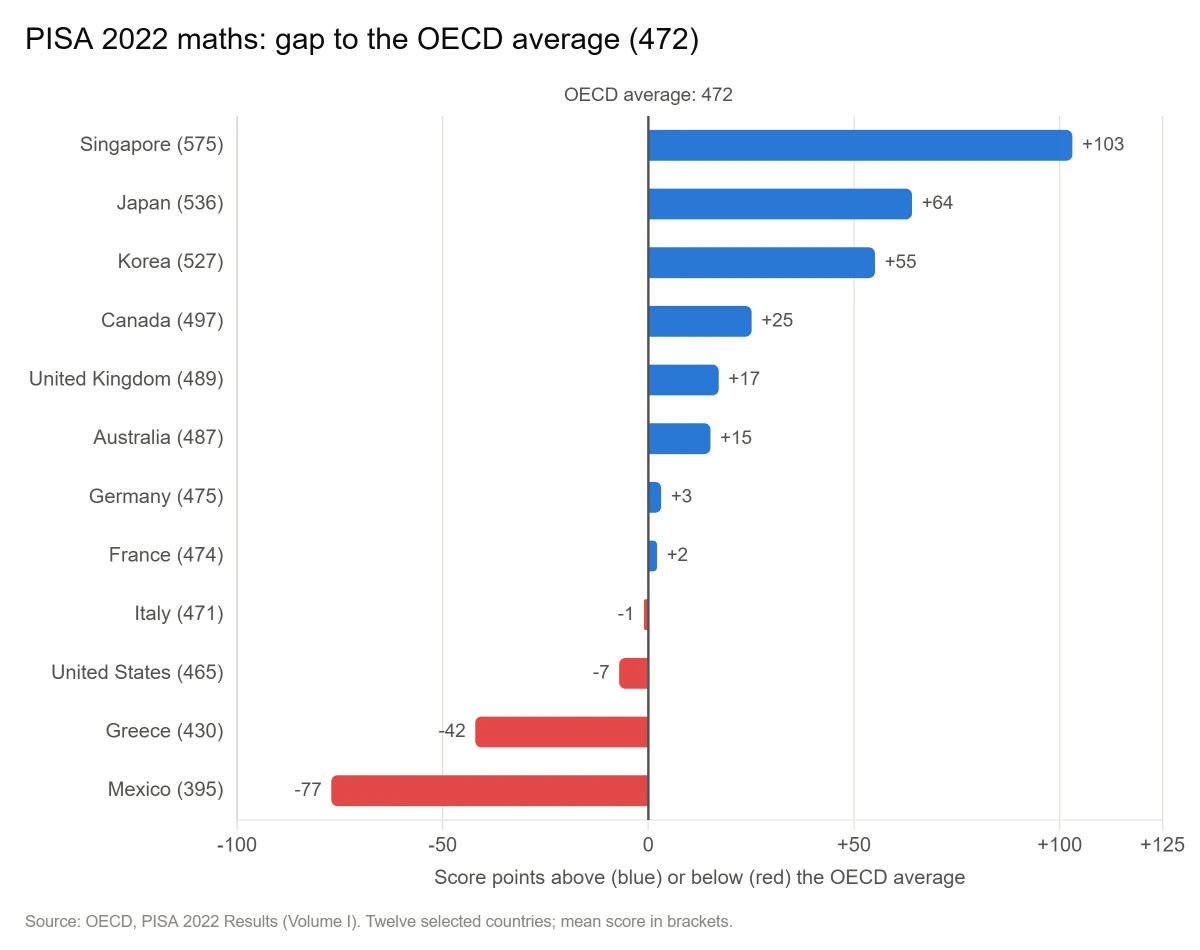
What the chart does. Raw scores between 395 and 575 would produce twelve bars of similar length. Plotting the gap makes the zero line the benchmark, so above and below are visible at a glance.
Two warnings this dataset teaches. First, benchmarks move. The OECD average itself fell by almost 15 points in maths between 2018 and 2022, so always date-stamp a benchmark. Second, benchmarks are estimates. Germany's maths score is not statistically different from the OECD average, and the same holds for France and the United States. A +3 bar is not a real lead, which is where a target band beats a thin line.
Six design rules that make the line work
- Label the line on the chart. Write "Target: 2%" beside it. A legend makes readers look twice.
- Keep the reference quiet. Grey and dashed for the target, one accent colour for your data.
- State the gap. Put "1.6 points above target" in the title or tooltip.
- Start bar axes at zero. If the gap then looks too small, switch to dots or a gap chart instead of cutting the axis.
- Say whose target it is and when it is due. "82% by March 2027" is far more useful than "82%".
- Limit yourself to two reference lines. A third turns context into clutter.
Five mistakes to avoid
- The mystery line. An unlabelled line that could be a target, an average or last year.
- The stale target. Last year's goal left on this year's chart.
- The flat line for a moving target. It makes early periods look like misses and late ones like wins.
- The second y-axis. Putting the target on a different scale lets you manufacture any gap you like.
- Traffic lights everywhere. Red, amber and green on every bar removes the emphasis colour is meant to give.
How to add a target line in your tool
Menu names vary a little by version, so treat these as the general route.
- Excel: Add a Target column next to your data, include it in the chart, then change the chart type to Combo and set the Target series to Line.
- Google Sheets: Add a Target column, choose a Combo chart, then set that series to Line under Customize → Series.
- Power BI: Select the visual, open the Analytics pane and add a Constant line. For changing targets, use a line-and-column chart with a target measure.
- Tableau: Drag Reference Line from the Analytics pane onto the view, or pick the bullet graph from Show Me.
Pre-publish checklist
- Is every reference line labelled on the chart itself?
- Does the title state the gap as a number?
- Is it clear whether this is a target or a benchmark?
- Does the target show its owner and deadline?
- Is the benchmark dated and its source named?
- Do bars start at zero?
The takeaway
A chart without a reference point leaves the judgement to the reader, and each reader will guess differently. Add one labelled line and "74%" becomes "21 points short", which is the information your reader needs.
The three case studies each showed a different side of this:
- The Fed: when the target is a single fixed number, one dashed line and a stated gap are enough. September's 3.6% only means something next to the 2% goal.
- The NHS: when targets keep changing, show each period against its own target and keep the original standard on the chart. Otherwise a miss can pass for progress.
- PISA: a benchmark is a measurement, not a promise. The OECD maths average dropped by almost 15 points between 2018 and 2022, so date it, source it, and be careful with small gaps.
Before you publish your next chart, ask what the reader should compare the number with, then put that comparison on the chart and label it. If you only have time for one change, write the gap into the title: "Inflation is 1.6 points above target" tells the reader more than "Inflation, 2026".