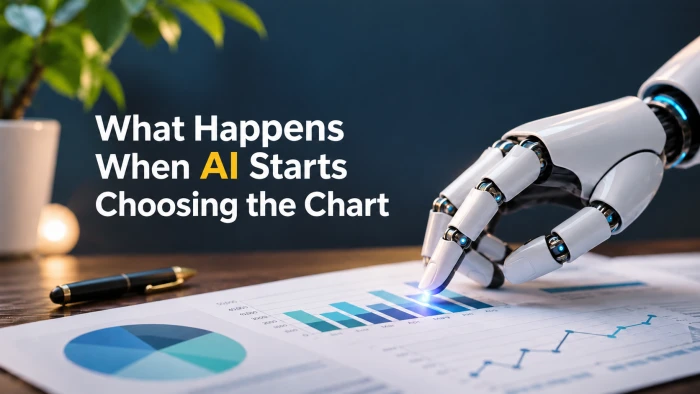
For most of the history of spreadsheets and dashboards, the chart was a human decision. You looked at the data, thought about the question, and picked a bar, a line, or a scatter. That step is quietly disappearing. Power BI, Google Sheets, Tableau, and tools like ChartGPT will now read your data, decide what you want to see, and draw it for you.
This post looks at what actually changes when the chart type is no longer your call: how each tool makes that choice, where they get it right, where they get it wrong, and how to keep control without giving up the speed.
Why the chart choice was always the hard part
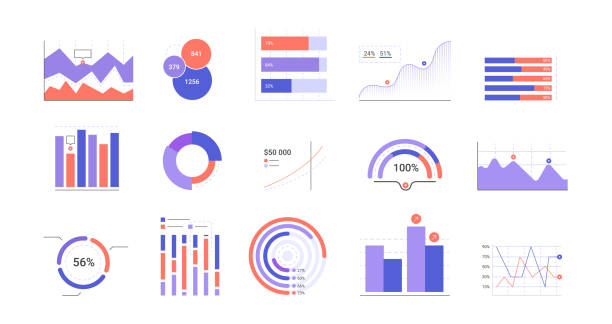
A chart is an argument. The same twelve months of revenue can look like steady growth on a line chart, a flat year on a bar chart with a wide axis, or a crisis on a bar chart with a truncated one. The numbers never change. The framing does.
That is why chart selection used to sit with analysts. It required three things at once:
- Knowing what kind of data you have (categories, time, parts of a whole, relationships between two measures)
- Knowing what question the reader is asking
- Knowing which visual encodings people read accurately (length and position) and which they read poorly (angle, area, color intensity)
AI tools now handle the first of those well, the second partly, and the third inconsistently. Understanding that split is the whole game.
How AI actually picks a chart
Under the hood, most AI charting features follow a similar pattern:
- Profile the data. The model scans column types. Dates suggest a time series. A text column with few unique values suggests categories. Two numeric columns suggest a relationship.
- Read the prompt for intent. "Compare regions" pushes toward bars. "Over time" pushes toward lines. "Share of" pushes toward pie or donut.
- Apply a default mapping. Each vendor has a rulebook, learned or hand-written, that maps data shape plus intent to a chart type.
- Generate the chart, either as a native object in the tool, as code that renders an image, or as a structured specification that a drawing engine turns into a picture.
The quality of step 3 varies a lot between tools, and so does step 4. Together they explain almost every surprising result you will see.
The tools, and how each one decides
Microsoft Copilot in Power BI
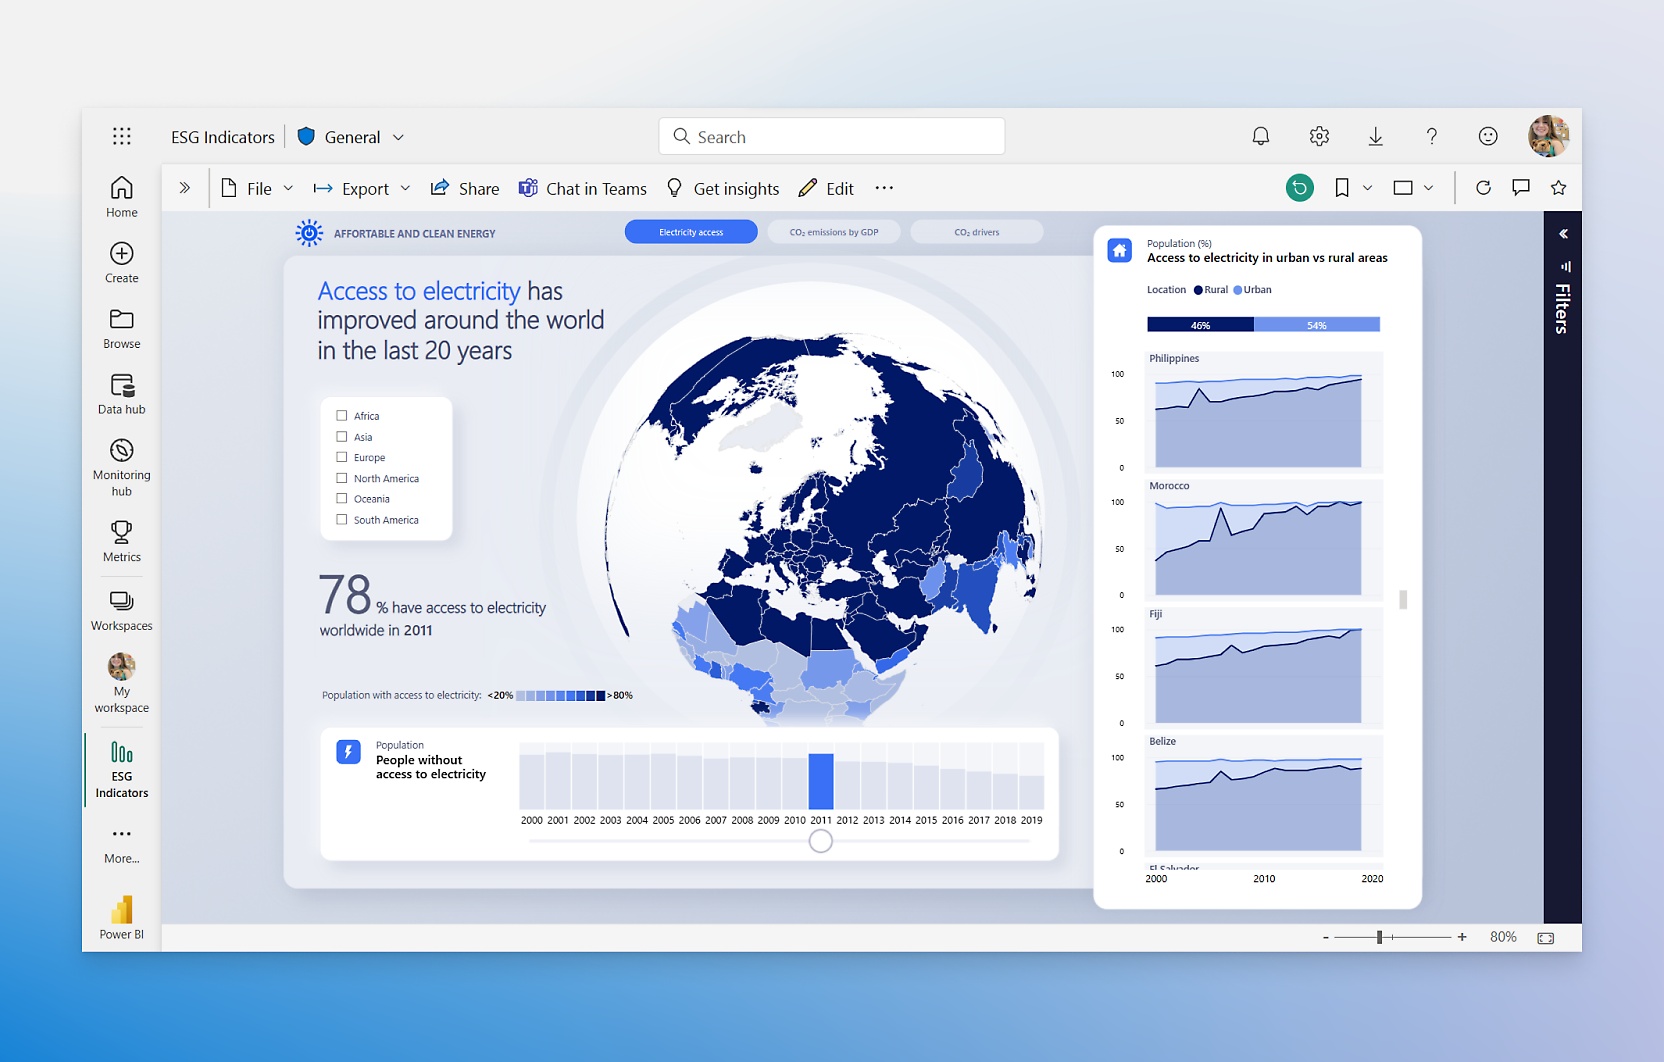
Copilot in Power BI works inside a report in edit mode. You open the Copilot pane, describe the page you want, and it generates a report page based on your request, then lets you prompt it to add, delete, or change visuals. Microsoft's own documentation says the newer version delivers more accurate and relevant visuals by automatically selecting the best way to represent your data.
What makes it different: it works from your semantic model, so it knows your measures and relationships rather than guessing from raw columns. The trade-off is that it only works inside that model. The Q&A feature switch must be turned on, real-time streaming models are not supported, and live connections to Analysis Services cannot be used for page creation.
Where it stops short: it works best for structural changes, not visual polish; styling, conditional formatting, and layout consistency remain largely manual.
Microsoft's full guide: Create and edit Power BI reports with Copilot.
Gemini in Google Sheets
Gemini sits in a side panel in Sheets. Google first shipped chart generation in January 2025, when complex prompts were turned into Python code behind the scenes and charts were generated as static images that did not update with the data. Google later fixed that: the charts are now editable and stay synced with your data, though an inserted chart appears in a new tab within the spreadsheet rather than on the source sheet.
How it decides: the prompt does most of the work. A request such as "create a chart with date on the x-axis and total on the y-axis" produces a chart in the side panel, which you then insert and edit for title, colors, and more.
Practical notes: Google advises being as specific as possible in prompts, and says performance is most consistent in files below one million cells. Clean headers and no missing values matter here, because Gemini has no semantic model to lean on.
Google's announcement with examples: Generate charts and insights using Gemini in Google Sheets.
Tableau Agent and Tableau Pulse
Tableau splits the job across two features. Tableau Agent lets users type natural language to generate visualizations within a workbook context, while Tableau Pulse monitors published dashboards and surfaces metric changes and anomalies automatically.
Agent is the chart chooser. Given a request like churn rate by region, it identifies relevant data sources, creates a calculated field, generates a line chart segmented by region, and provides a plain-language summary of the trend. Pulse does not really choose charts at all; it chooses what to tell you, pairing short metric cards with sparklines and text.
Things to know: Agent and Pulse require Tableau+, a premium tier with undisclosed pricing on top of Creator licenses, and when Agent answers a question about "revenue" it picks the first matching workbook, so the definition may not match what the user meant. Tableau has also been moving fast; MCP servers reached general availability in May 2026 and Agent gained dashboard capabilities in June 2026.
ChartGPT
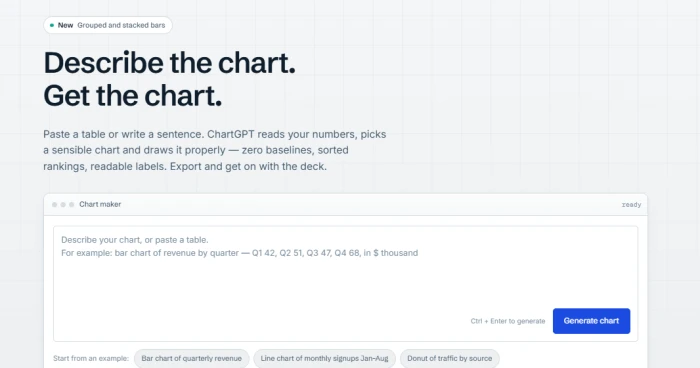
ChartGPT is built for the moment when you are not inside a BI platform at all. You have numbers in a spreadsheet, an email, or your head, and you need a chart for a deck in the next few minutes. You paste a table or write a sentence, and it reads your numbers, picks a sensible chart and draws it properly, with zero baselines, sorted rankings, and readable labels.
How it decides: if you name a chart type, you get that type. If you do not, ChartGPT picks based on the shape of your data: time gets a line, categories get bars, shares of a total get a donut. It covers nine chart types, including bar, horizontal bar, grouped bar, stacked bar, line, area, pie, donut, and scatter.
What sets it apart from the other three is where the AI stops. It uses OpenAI models only for the language step, reading the prompt and turning it into a structured chart specification, while the drawing itself is its own code, which is why charts come out looking consistent rather than reinvented each time. The model decides what to chart; a fixed set of rules decides how it looks.
Those rules are deliberately opinionated:
- Bars start at zero because a bar's length is the value; if you need a close-up of a narrow range, you get a line chart with a labelled axis instead.
- Colour carries meaning. One series gets one colour, and when you want to point at a single bar, everything else goes grey.
- Titles state the finding. Tell it what the chart is for and you get "Q4 was the strongest quarter of the year" rather than "Revenue by quarter."
- It asks when it is unsure. If a column could be March or April, or a total does not add up, it says so instead of quietly picking.
Input and output: you can paste a sentence with the numbers in it, a table from Excel, Google Sheets or a CSV, or a mix, up to 500 rows at a time on any plan. Export is PNG, SVG and PDF on every plan and without an account, plus the chart specification as JSON.
Where it stops short: switching chart type redraws instantly, but the title, sort order, units and included values are changed by editing your prompt and generating again, and colours and the axis range are chosen automatically and cannot be overridden today. There is also no chart history on any plan; the chart lives in the browser tab you made it in, so export it before you close it. It is a chart maker, not a dashboard, and it does not try to be one.
You can see a worked example and a note on when to use something else for each type on the ChartGPT chart types page.
What goes right when the AI picks
Speed is the obvious win, but it is not the biggest one. The biggest one is that people who never made charts now make them. A marketing manager who would have exported to Excel and emailed an analyst can now ask Sheets, or paste the numbers into ChartGPT, and have the chart before the email would have been written.
Three more benefits show up consistently:
- Fewer blank-page moments. A draft chart is easier to critique than an empty canvas.
- Better defaults for common data shapes. Time series almost always come back as lines. Category comparisons almost always come back as sorted bars. For ordinary business data this is correct most of the time.
- Built-in narration. Power BI, Tableau, and Gemini attach a sentence or two explaining the chart. ChartGPT goes a step further by putting the finding in the title, which is often the only line a busy reader sees.
What goes wrong when the AI picks
The failures are quieter than the successes, which is what makes them dangerous.
The chart answers a different question. You ask about customer retention; the tool charts customer count. Both are in the data. The AI picked the one with the cleaner column.
The default encoding misleads. Pie charts for eight categories. Axes that start at the minimum value instead of zero. Colors that imply a ranking where none exists. Tools built on general-purpose code generation are the most prone to this, because they will draw whatever the training data drew most often. Tools with fixed drawing rules avoid the worst of it, at the cost of some flexibility.
Definitions drift. The Tableau example above is the general case: "revenue" might mean gross, net, booked, or recognized depending on which workbook or table the tool picked first. The chart looks authoritative either way.
The skill atrophies. If nobody on the team ever chooses a chart, nobody on the team learns why a chart is wrong. The ability to spot a misleading visual depends on having made a few yourself.
Trust runs ahead of accuracy. A clean, labeled chart from a well-known product reads as verified. It is not. It is a first draft produced by a system that has never seen your business.
A workflow that keeps you in charge
The practical answer is not to avoid these tools. It is to treat the AI chart the way a good editor treats a first draft.
1. Write the question before the prompt. "Did Q3 retention improve in EMEA compared to Q2?" is a prompt the tool can act on. "Show me retention" is not.
2. Name the measure. Say "net revenue after refunds" rather than "revenue" so the tool does not pick a definition for you.
3. Run a five-second check on every chart. Does the axis start where it should? Is the time period complete? Are the categories sorted? Is the chart type one a reader can decode by length or position?
4. Ask for the alternative. "Show me the same data as a line chart" costs nothing and often reveals that the first pick was wrong. In ChartGPT this is a single click; in the BI tools it is one more prompt.
5. Keep one chart to one point. The tools will happily add a second axis or a fourth series if you ask. Resist. We have written before about why simpler charts often carry stronger arguments, and AI generation makes that discipline more important, not less.
6. Save what works. Once you have a chart you trust, keep the exported SVG or the JSON spec, or save it as a verified answer in your BI tool, so the next person does not start from the AI's guess.
Where this is heading
The BI vendors are converging on the same architecture: a semantic layer that defines every metric once, an agent that chooses the chart, and a monitoring layer that tells you when a metric moves. Tableau calls this agentic analytics; Microsoft and Google are building the same stack under different names.
The lightweight end of the market is going a different direction: fewer choices, stricter rules, faster output. A tool that refuses to draw a bar chart without a zero baseline is making a bet that most people would rather have a correct chart than a configurable one.
The likely end state is that chart choice becomes something humans override rather than something they initiate. That is fine, as long as the override is easy, visible, and used. The teams that get the most out of these tools will be the ones that still know what a bad chart looks like.