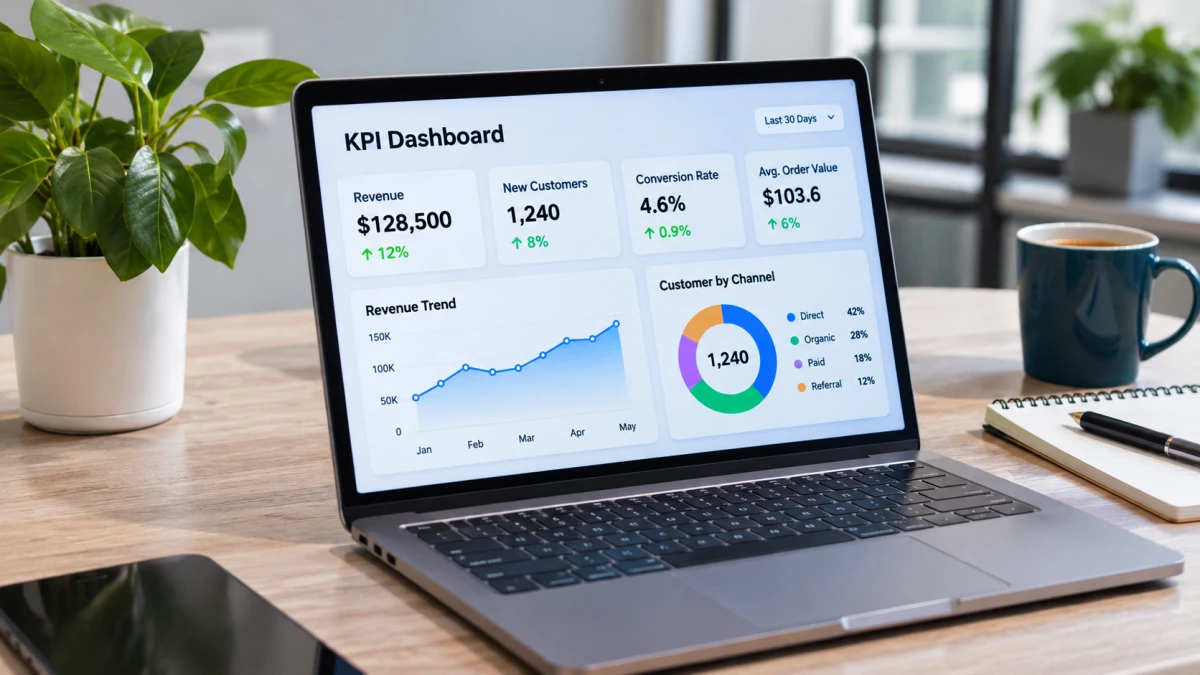
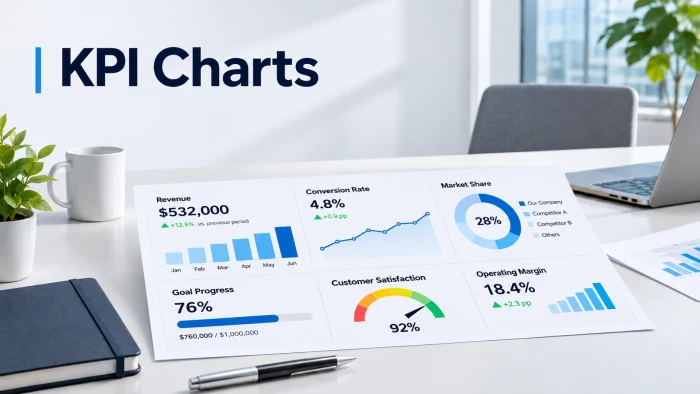
You spent hours building it. Your team glances at it for three seconds and moves on.
The numbers are fine. The charts are the problem. Put the right metric in the wrong chart and a win looks like a loss, a warning looks like noise, and nobody acts.
The good news: there is a correct chart for almost every type of KPI, and science backs it up.
The 1984 experiment that settled the argument
Back in 1984, statisticians William Cleveland and Robert McGill tested how accurately people read data in different visual forms. Their verdict: position against a common scale was read most accurately, followed by length, then angle, then area.
Translation: bars and lines beat pies and bubbles.
Decades later, researchers Heer and Bostock reran the experiments with a crowdsourced audience and the ranking largely held.
One fair warning before you delete every pie chart you own: the accuracy differences in the original study were often very small. Treat this as a strong guideline, not a law.
The cheat sheet (screenshot this)
| If your KPI shows | Use this | Skip this |
|---|---|---|
| One big number | KPI card | Gauge or dial |
| Change over time | Line chart | Pie chart |
| Progress to a target | Bullet chart | Speedometer |
| Category comparison | Sorted bar chart | 3D anything |
| Share of a whole | Stacked bar | Pie with 6+ slices |
| Drop-off by stage | Funnel chart | Table of numbers |
| Why a total changed | Waterfall chart | Two bars side by side |
| Two metrics together | Scatter plot | Dual-axis line chart |
8 fixes, one for every metric type
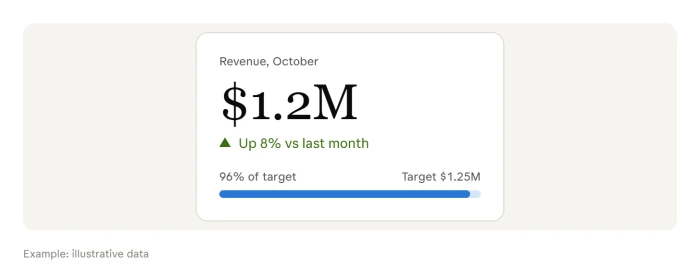
1. The headline number: give it a KPI card
One number. Big type. One comparison beside it. A well-designed KPI often shows only three things: actual, target, and trend.
Try this (illustrative): "Revenue: $1.2M, up 8% vs last month, 96% of target."
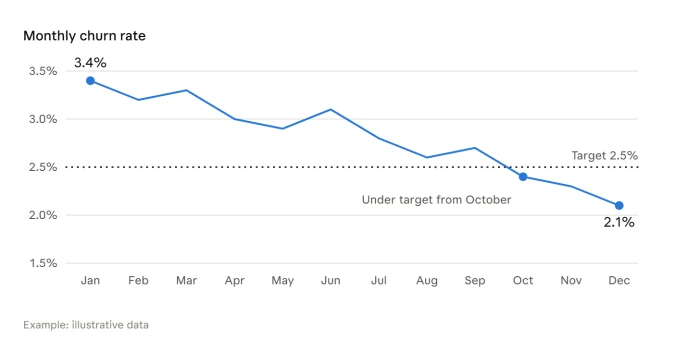
2. The trend: draw a line
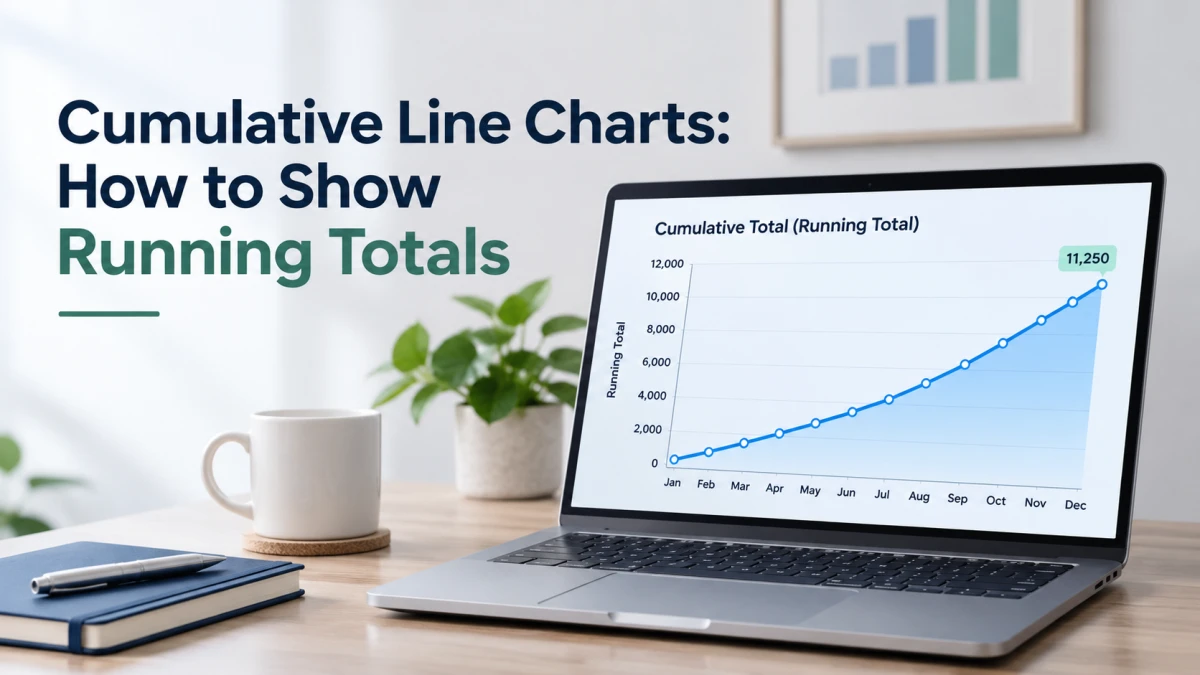
Tracking anything by day, week, or month? Use a line chart. The slope tells the story before anyone reads a label. Add a dotted target line and you have instant context.
Try this: 12 months of churn rate with the target rate marked.
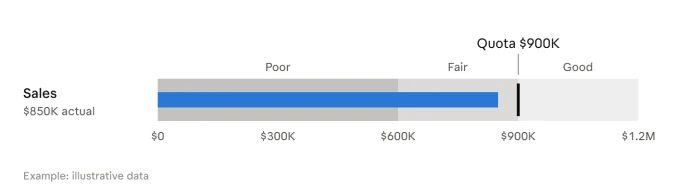
3. The target chase: ditch the gauge, use a bullet
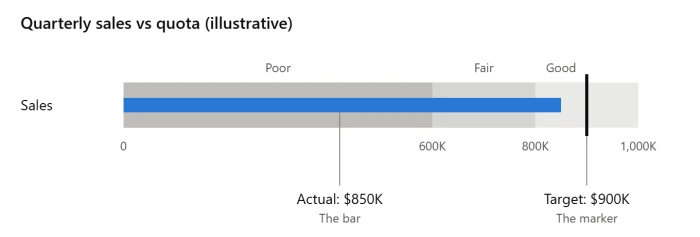
Gauges look impressive and say very little. That is exactly why Stephen Few developed the bullet graph as a replacement for dashboard gauges and meters. It shows one primary measure and compares it to another measure, such as a target, to give it meaning. See the full anatomy in Wikipedia's bullet graph entry.
Your BI tool probably has one already. In Looker Studio, a bullet chart shows a single metric with an optional target and up to three ranges, as covered in Google Cloud's bullet chart reference.
Try this (illustrative): $850K in sales as a bar, a marker at the $900K quota, shaded bands for poor, fair, and good.
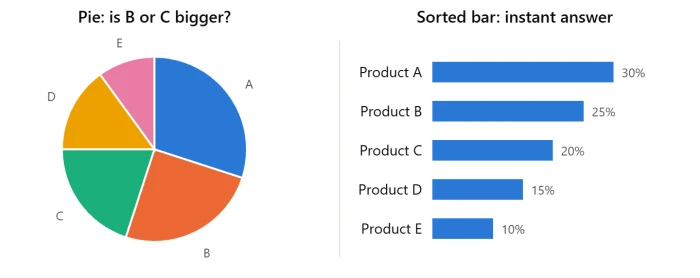
4. The comparison: sort your bars
Bar charts use length on a shared baseline, one of the most accurately read formats. Sort largest to smallest. Go horizontal when labels are long.
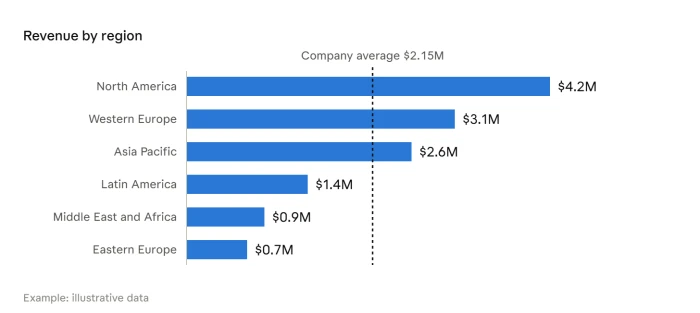
Try this: Revenue by region with the company average as a reference line.
5. The share: pies only for two or three slices
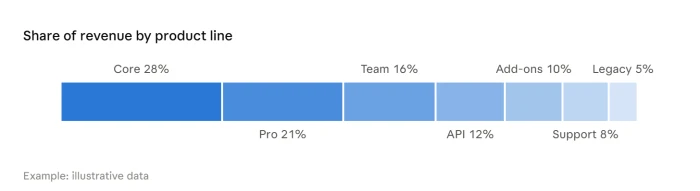
Pies depend on angle, which ranks below length for accuracy. "New vs returning customers" works fine as a pie. Seven product lines does not. Use a stacked bar instead.
6. The leak: build a funnel
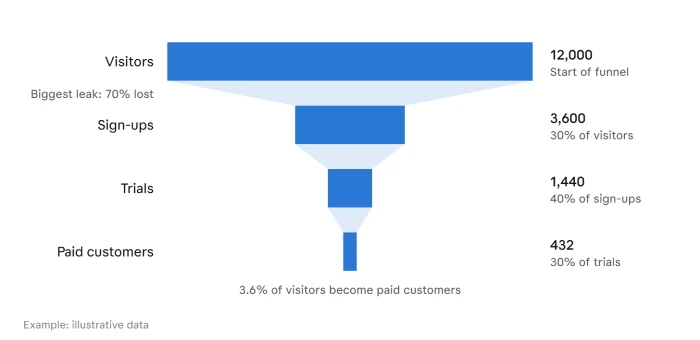
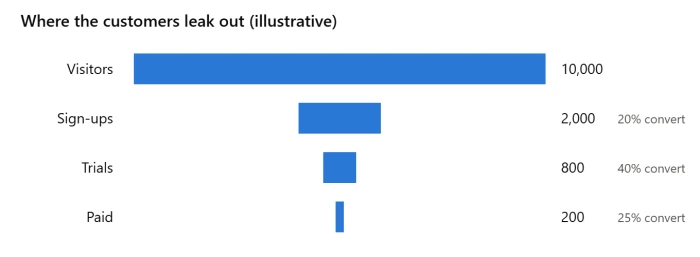
Where are you losing people? A funnel shows it instantly. Label every stage with the count and the conversion rate, because the drop-off is the insight.
Try this: Visitors, sign-ups, trials, paid customers.
7. The "what happened?": use a waterfall
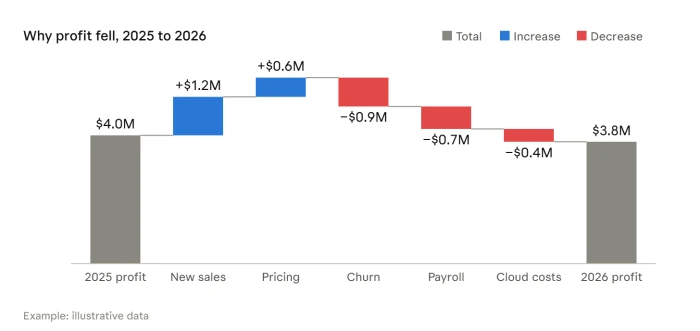
Profit fell. Why? A waterfall walks from the starting value to the ending value, one gain or loss at a time. Finance teams rely on it for profit bridges and budget variance.
8. The hidden pattern: scatter plots and heatmaps
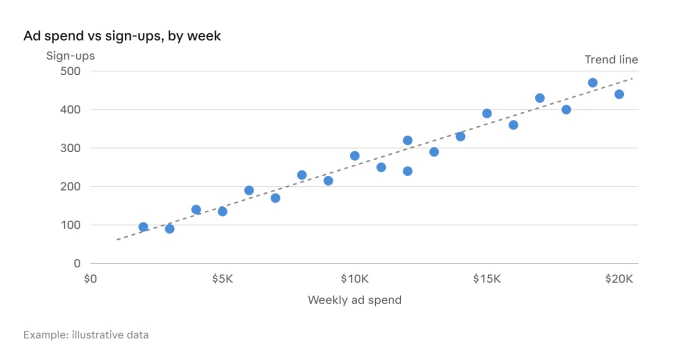
Does more ad spend bring more sign-ups? Scatter plot. When do support tickets spike? Heatmap by hour and weekday.
Steal these: the right KPI chart for every team
Not sure where to start? Find your team and copy the setup. Each pick follows the rules above.
| Team | KPI | Chart to use | Why it works |
|---|---|---|---|
| Sales | Revenue vs quota | Bullet chart | Shows actual, target, and performance bands in one row |
| Sales | Pipeline by stage | Funnel chart | Makes the biggest drop-off obvious |
| Marketing | Website sessions by month | Line chart | Trend and seasonality at a glance |
| Marketing | Leads by channel | Sorted bar chart | Easy ranking of best and worst channels |
| Finance | Profit change year over year | Waterfall chart | Explains what drove the change |
| Finance | Cash balance | KPI card | One number that needs no decoration |
| Support | Tickets by hour and weekday | Heatmap | Reveals staffing gaps |
| Support | Average response time vs goal | Bullet chart | Instant pass or fail against the standard |
| Product | Monthly active users | Line chart | Shows growth direction and speed |
| Product | Usage vs retention by feature | Scatter plot | Shows which features go with loyal users |
Quick win: pick only the top three KPIs for your team and build those first. A dashboard with three charts people read beats one with twenty they ignore.
Case study: how Heathrow keeps 200,000 passengers a day moving
The problem. More than 200,000 passengers travel through Heathrow each day. Volumes swing constantly, and by the time a queue is visible, it is already too late.
The move. Heathrow uses Azure to pull data from back-end business systems into Power BI, which shows employees in real time how passenger traffic is changing, according to Microsoft's Heathrow customer story. That operational data reaches about 75,000 airport workers. It covers flight movements, passenger transfers, security queues, and immigration queues.
The payoff.
- Machine learning on the departure schedule helps Heathrow make sure it has enough people on the security lines.
- A queue longer than five minutes counts as a breach of customer experience, so everyone knows the line that cannot be crossed.
- After a later platform upgrade, forecasting dropped from two weeks and two people to four hours and one person, and the margin of error fell from 30% to 10%.
How the 8 fixes apply. Heathrow's public materials describe the metrics, not every chart on screen. Here is how this guide would chart them:
| Heathrow metric | Best chart |
|---|---|
| Current security wait time | KPI card with the five-minute limit |
| Wait time vs standard, by terminal | Bullet charts, one per terminal |
| Passenger flow forecast for the day | Line chart, actual vs forecast |
| Queue length by checkpoint | Sorted bar chart |
| Volume by hour and weekday | Heatmap |
The takeaway: a few clear metrics, shown to the people who can act on them, at the moment they need them.
5 dashboard sins to stop today
- Chopping the axis on a bar chart. Bars show value by length. Start at zero.
- A number with no context. Always add a target or prior period.
- Color as the only signal. Bullet graphs use intensities of a single hue so color-blind readers can tell the ranges apart. Copy that idea.
- Ten metrics in one chart. One chart, one question.
- The 9-slice pie. Make it a sorted bar chart.
The 5-second test
Before you publish any chart, hand it to a colleague. If they can't understand it in five seconds, simplify it.
Pick one chart on your dashboard today, run the test, and fix it. Then do the next one.
Which chart on your dashboard would fail the 5-second test? Start there.