
You've seen this chart. Forty skinny bars, labels tilted sideways, a legend with more colors than a paint store. Someone had the data, so they plotted all of it.
So where is the line? Here's the quick version, then the reasoning.
TL;DR
- No official limit exists. Readability is the limit.
- Vertical bars get tight past 10 to 12 categories.
- Horizontal bars hold up to about 25 to 30.
- Beyond that, show a Top N or use a table.
These are rules of thumb from simple space math, not research findings.
Your chart has a space budget
Every category needs room for two things: a bar and a label you can read. Take your chart width, divide by the number of categories, and you have your budget per bar.
On a 600 px wide chart:
- 6 categories get 100 px each. Plenty.
- 12 categories get 50 px each. Short labels only.
- 25 categories get 24 px each. Labels must rotate or shrink.
- 51 categories get about 12 px each. Nothing fits.
For scale, a word like "California" in 12 px type needs roughly 60 to 70 px. That one number explains most crowded charts.
Apple puts the principle plainly in its guidance on charting data: keep a chart simple and resist the urge to pack in as much data as possible, because too much data hides the relationships you want people to see.
Three habits that buy you more room

Sort by value. Alphabetical order is easy for you and hard for the reader. Microsoft's advice on selecting report visuals says categorical charts should mostly be sorted by value, with category order kept for things that have a set sequence, like steps in a process.
Put categories on the axis, not in the legend. The same Microsoft guidance warns that when you have many category values, visuals that split data by color, such as a stacked bar with a legend, are the wrong pick.
Go horizontal. Labels read left to right with no head tilting, and rows stack more tightly than columns.
Grouped and stacked bars multiply the problem (new)
So far we've counted categories. Add a second variable and you need to count marks instead.
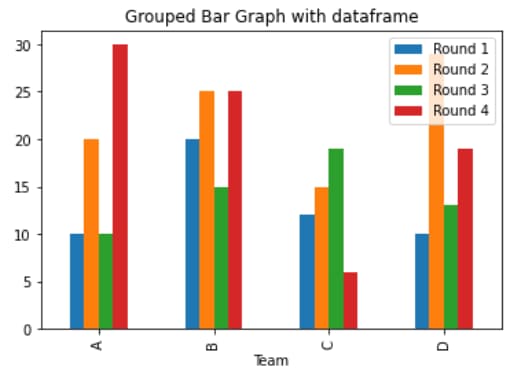
The math is simple: categories × series = bars on screen.
- 5 regions × 3 years = 15 bars. Comfortable.
- 12 products × 4 quarters = 48 bars. On a 600 px chart that is about 12 px each, the same squeeze as the 51 bar chart above.
Stacking saves width but spends color. Each series needs its own color and a legend entry, which is the setup Microsoft advises against when category values are many. Its own example of a readable 100% stacked bar chart compares four stores across six product categories.
A good habit: multiply before you build. If the result is past 20 or so, cut a dimension, filter one, or split the chart.
When many bars are fine
Dates are the exception. Apple's Swift Charts documentation shows a battery chart with 48 bars, one for every 30 minutes, and only a few axis labels. It works because you read the shape over time. Nobody needs a label on bar 37.
So the question is not only "how many bars?" It is also "does the reader need to identify each one?"
Phone screens cut your budget in half (new)
Run the same space math on a phone. With a chart about 360 px wide:
- 6 categories get 60 px each. Short labels fit.
- 12 categories get 30 px each. Labels must rotate.
- 25 categories get about 14 px each. Unreadable.
A chart that works on a laptop at 12 columns is already struggling on a phone.
Horizontal bars hold up better here because phones scroll vertically. At about 20 px per row, 15 rows need only 300 px of height. If part of your audience reads on mobile, design the horizontal version first and treat about 6 as your ceiling for vertical bars.
Case study: one dataset, three charts
The data: the 2020 US Census counted 331,449,281 residents across the 50 states and the District of Columbia. That gives us 51 categories.
Attempt 1: all 51, vertical, alphabetical
Each state gets about 12 px. Every label is rotated. California sits in 5th position and Texas in 44th, so the ranking is invisible. This is the chart from the opening paragraph.
Attempt 2: all 51, horizontal, sorted
Much better. Labels fit and the ranking is obvious. The catch is height: at about 20 px per row, the chart runs past 1,000 px. Good for a reference page people scroll. Bad for a slide.
Attempt 3: Top 10, horizontal, sorted
| Rank | State | 2020 population | Share of US |
|---|---|---|---|
| 1 | California | 39,538,223 | 11.9% |
| 2 | Texas | 29,145,505 | 8.8% |
| 3 | Florida | 21,538,187 | 6.5% |
| 4 | New York | 20,201,249 | 6.1% |
| 5 | Pennsylvania | 13,002,700 | 3.9% |
| 6 | Illinois | 12,812,508 | 3.9% |
| 7 | Ohio | 11,799,448 | 3.6% |
| 8 | Georgia | 10,711,908 | 3.2% |
| 9 | North Carolina | 10,439,388 | 3.1% |
| 10 | Michigan | 10,077,331 | 3.0% |
Source: US Census Bureau, 2020 Census resident population. Shares calculated from the national total.
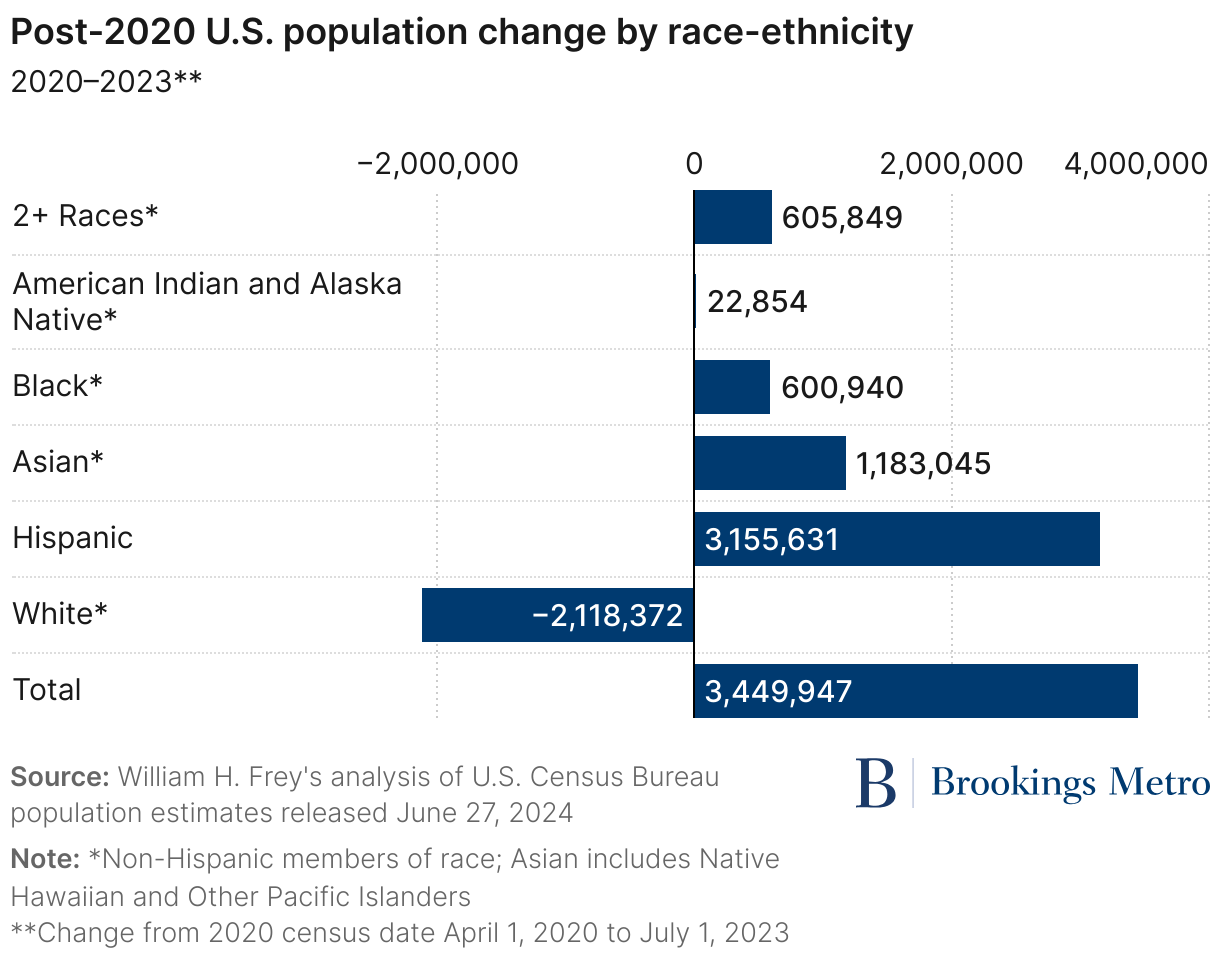
The Census Bureau noted that the top five states alone held 37.2% of residents. Run the sum for ten and you reach 179,266,447 people, or 54.1%. Ten bars, more than half the country.
The "Other" trap
It is tempting to add an eleventh bar for everyone else. Do the math first. The remaining 41 areas total 152,182,834 people, about 3.8 times California. That single bar would flatten the ten you care about.
Better move: leave it off and say it in the subtitle. "The 10 largest states hold 54.1% of US residents."
Your tool probably does this already
Google builds the Top N approach straight into its product. In the Data Studio bar chart settings (formerly Looker Studio), charts show the Top N by default, you choose the number of bars, and grouping the rest as "Others" is switched on by default.
When you can't cut anything (new)
Sometimes every category matters. A compliance report needs all 51 states. A product team needs all 80 SKUs. Trimming to a Top 10 is not an option, so change the format instead.
A table with data bars. Microsoft's guidance points out that tables are often overlooked and that data bars inside a table help people read the distribution quickly. You keep every row, every exact number, and a visual cue for size.
A treemap. If the point is share of a whole, Microsoft lists the treemap among its proportional visuals. Rectangles pack into two dimensions, so they use space that bars leave empty.
Drill down. Start with a few groups and let readers open the detail. Group the 51 areas into the four census regions, then click into one. Google's bar charts support this: with drill down turned on, each added dimension becomes another level of detail.
Zoom or filter. Google also offers a zoom option that lets viewers pan across a chart to see all the data. A filter does the same job by letting each reader pick their own subset.
The rule here: when you can't reduce the data, reduce what is on screen at one time.
Pick your chart in 10 seconds
| You have | Use |
|---|---|
| Up to 7 categories | Any bar chart, all labels showing |
| 8 to 15 | Horizontal bars, sorted |
| 16 to 30 | Horizontal bars if every item matters, otherwise Top N |
| More than 30 | Top N, a table with data bars, or a filter |
| Two variables | Multiply categories by series first, aim for about 20 bars or fewer |
| Dates or other ordered data | Many bars are fine, label a few |
The one test to remember
Before you publish, divide your chart width by your bar count and ask whether one label fits in that space. If yes, ship it. If no, sort, flip, trim, or switch to a table.
Two notes on the new sections: the 360 px phone width is an example figure for the math, so swap in your own audience's screen size if you have it. The "about 20 bars" ceiling for grouped charts is a rule of thumb from the same space math, not a published limit.